Description
I would like to contribute to mcp-server-uyuni, the MCP server for Uyuni / Multi-Linux Manager) exposing additional features as tools. There is lots of relevant features to be found throughout the API, for example:
- System operations and infos
- System groups
- Maintenance windows
- Ansible
- Reporting
- ...
At the end of the week I managed to enable basic system group operations:
- List all system groups visible to the user
- Create new system groups
- List systems assigned to a group
- Add and remove systems from groups
Goals
- Set up test environment locally with the MCP server and client + a recent MLM server [DONE]
- Identify features and use cases offering a benefit with limited effort required for enablement [DONE]
- Create a PR to the repo [DONE]
Resources

This project is part of:
Hack Week 25
Activity
Comments
Be the first to comment!
Similar Projects
SUSE Observability MCP server by drutigliano
Description
The idea is to implement the SUSE Observability Model Context Protocol (MCP) Server as a specialized, middle-tier API designed to translate the complex, high-cardinality observability data from StackState (topology, metrics, and events) into highly structured, contextually rich, and LLM-ready snippets.
This MCP Server abstract the StackState APIs. Its primary function is to serve as a Tool/Function Calling target for AI agents. When an AI receives an alert or a user query (e.g., "What caused the outage?"), the AI calls an MCP Server endpoint. The server then fetches the relevant operational facts, summarizes them, normalizes technical identifiers (like URNs and raw metric names) into natural language concepts, and returns a concise JSON or YAML payload. This payload is then injected directly into the LLM's prompt, ensuring the final diagnosis or action is grounded in real-time, accurate SUSE Observability data, effectively minimizing hallucinations.
Goals
- Grounding AI Responses: Ensure that all AI diagnoses, root cause analyses, and action recommendations are strictly based on verifiable, real-time data retrieved from the SUSE Observability StackState platform.
- Simplifying Data Access: Abstract the complexity of StackState's native APIs (e.g., Time Travel, 4T Data Model) into simple, semantic functions that can be easily invoked by LLM tool-calling mechanisms.
- Data Normalization: Convert complex, technical identifiers (like component URNs, raw metric names, and proprietary health states) into standardized, natural language terms that an LLM can easily reason over.
- Enabling Automated Remediation: Define clear, action-oriented MCP endpoints (e.g., execute_runbook) that allow the AI agent to initiate automated operational workflows (e.g., restarts, scaling) after a diagnosis, closing the loop on observability.
Hackweek STEP
- Create a functional MCP endpoint exposing one (or more) tool(s) to answer queries like "What is the health of service X?") by fetching, normalizing, and returning live StackState data in an LLM-ready format.
Scope
- Implement read-only MCP server that can:
- Connect to a live SUSE Observability instance and authenticate (with API token)
- Use tools to fetch data for a specific component URN (e.g., current health state, metrics, possibly topology neighbors, ...).
- Normalize response fields (e.g., URN to "Service Name," health state DEVIATING to "Unhealthy", raw metrics).
- Return the data as a structured JSON payload compliant with the MCP specification.
Deliverables
- MCP Server v0.1 A running Golang MCP server with at least one tool.
- A README.md and a test script (e.g., curl commands or a simple notebook) showing how an AI agent would call the endpoint and the resulting JSON payload.
Outcome A functional and testable API endpoint that proves the core concept: translating complex StackState data into a simple, LLM-ready format. This provides the foundation for developing AI-driven diagnostics and automated remediation.
Resources
- https://www.honeycomb.io/blog/its-the-end-of-observability-as-we-know-it-and-i-feel-fine
- https://www.datadoghq.com/blog/datadog-remote-mcp-server
- https://modelcontextprotocol.io/specification/2025-06-18/index
- https://modelcontextprotocol.io/docs/develop/build-server
Basic implementation
- https://github.com/drutigliano19/suse-observability-mcp-server
Results
Successfully developed and delivered a fully functional SUSE Observability MCP Server that bridges language models with SUSE Observability's operational data. This project demonstrates how AI agents can perform intelligent troubleshooting and root cause analysis using structured access to real-time infrastructure data.
Example execution
MCP Server for SCC by digitaltomm
Description
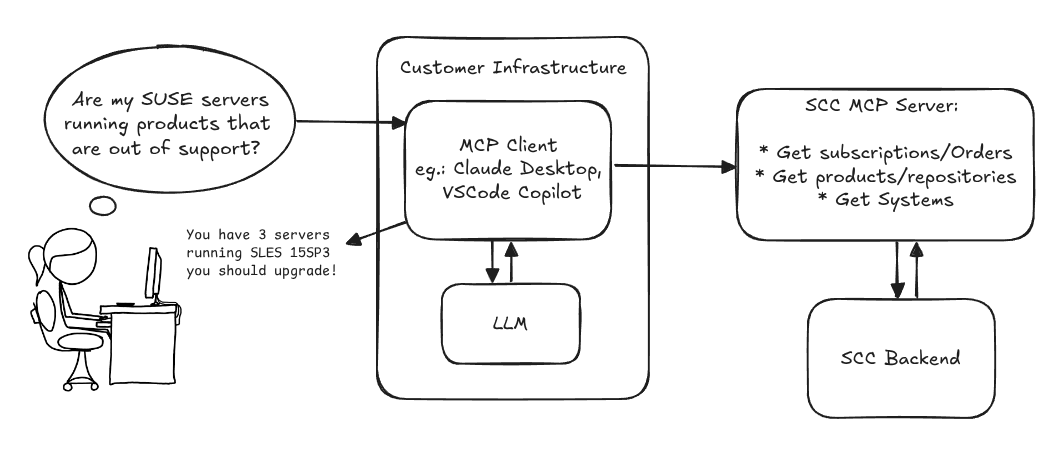
Provide an MCP Server implementation for customers to access data on scc.suse.com via MCP protocol. The core benefit of this MCP interface is that it has direct (read) access to customer data in SCC, so the AI agent gets enhanced knowledge about individual customer data, like subscriptions, orders and registered systems.
Architecture
Goals
We want to demonstrate a proof of concept to connect to the SCC MCP server with any AI agent, for example gemini-cli or codex. Enabling the user to ask questions regarding their SCC inventory.
For this Hackweek, we target that users get proper responses to these example questions:
- Which of my currently active systems are running products that are out of support?
- Do I have ready to use registration codes for SLES?
- What are the latest 5 released patches for SLES 15 SP6? Output as a list with release date, patch name, affected package names and fixed CVEs.
- Which versions of kernel-default are available on SLES 15 SP6?
Technical Notes
Similar to the organization APIs, this can expose to customers data about their subscriptions, orders, systems and products. Authentication should be done by organization credentials, similar to what needs to be provided to RMT/MLM. Customers can connect to the SCC MCP server from their own MCP-compatible client and Large Language Model (LLM), so no third party is involved.
Milestones
[x] Basic MCP API setup
  MCP endpoints
  [x] Products / Repositories
  [x] Subscriptions / Orders
  [x] Systems
  [x] Packages
[x] Document usage with Gemini CLI, Codex
Resources
Gemini CLI setup:
~/.gemini/settings.json:
Intelligent Vulnerability Detection for Private Registries by ibone.gonzalez
Description:
This project wants to build an MCP server that connects your LLM to your private registry. It fetches vulnerability reports, probably generated by Trivy, with all the CVEs, and uses the LLM to develop the exact terminal commands or containers updates needed to resolve them.
Goals:
Our goal is to build an MCP for private registries that:
Detects Vulnerabilities: Proactively finds risks in your packages.
Automates Security: Keeps software secure with automated checks and updates.
Fits Your Workflow: Integrates seamlessly so you never leave your tools.
Protects Privacy: Delivers actionable insights without compromising private data.
To provide automated, privacy-first security for private packages that deliver actionable risk alerts directly within the developer’s existing workflow.
Resources:
Code:
Bugzilla goes AI - Phase 1 by nwalter
Description
This project, Bugzilla goes AI, aims to boost developer productivity by creating an autonomous AI bug agent during Hackweek. The primary goal is to reduce the time employees spend triaging bugs by integrating Ollama to summarize issues, recommend next steps, and push focused daily reports to a Web Interface.
Goals
To reduce employee time spent on Bugzilla by implementing an AI tool that triages and summarizes bug reports, providing actionable recommendations to the team via Web Interface.
Project Charter
Description
Project Achievements during Hackweek
In this file you can read about what we achieved during Hackweek.
SUSE Edge Image Builder MCP by eminguez
Description
Based on my other hackweek project, SUSE Edge Image Builder's Json Schema I would like to build also a MCP to be able to generate EIB config files the AI way.
Realistically I don't think I'll be able to have something consumable at the end of this hackweek but at least I would like to start exploring MCPs, the difference between an API and MCP, etc.
Goals
- Familiarize myself with MCPs
- Unrealistic: Have an MCP that can generate an EIB config file
Resources
Result
https://github.com/e-minguez/eib-mcp
I've extensively used antigravity and its agent mode to code this. This heavily uses https://hackweek.opensuse.org/25/projects/suse-edge-image-builder-json-schema for the MCP to be built.
I've ended up learning a lot of things about "prompting", json schemas in general, some golang, MCPs and AI in general :)
Example:
Generate an Edge Image Builder configuration for an ISO image based on slmicro-6.2.iso, targeting x86_64 architecture. The output name should be 'my-edge-image' and it should install to /dev/sda. It should deploy
    a 3 nodes kubernetes cluster with nodes names "node1", "node2" and "node3" as:
    * hostname: node1, IP: 1.1.1.1, role: initializer
    * hostname: node2, IP: 1.1.1.2, role: agent
    * hostname: node3, IP: 1.1.1.3, role: agent
    The kubernetes version should be k3s 1.33.4-k3s1 and it should deploy a cert-manager helm chart (the latest one available according to https://cert-manager.io/docs/installation/helm/). It should create a user
    called "suse" with password "suse" and set ntp to "foo.ntp.org". The VIP address for the API should be 1.2.3.4
Generates:
``` apiVersion: "1.0" image: arch: x86_64 baseImage: slmicro-6.2.iso imageType: iso outputImageName: my-edge-image kubernetes: helm: charts: - name: cert-manager repositoryName: jetstack
SUSE Observability MCP server by drutigliano
Description
The idea is to implement the SUSE Observability Model Context Protocol (MCP) Server as a specialized, middle-tier API designed to translate the complex, high-cardinality observability data from StackState (topology, metrics, and events) into highly structured, contextually rich, and LLM-ready snippets.
This MCP Server abstract the StackState APIs. Its primary function is to serve as a Tool/Function Calling target for AI agents. When an AI receives an alert or a user query (e.g., "What caused the outage?"), the AI calls an MCP Server endpoint. The server then fetches the relevant operational facts, summarizes them, normalizes technical identifiers (like URNs and raw metric names) into natural language concepts, and returns a concise JSON or YAML payload. This payload is then injected directly into the LLM's prompt, ensuring the final diagnosis or action is grounded in real-time, accurate SUSE Observability data, effectively minimizing hallucinations.
Goals
- Grounding AI Responses: Ensure that all AI diagnoses, root cause analyses, and action recommendations are strictly based on verifiable, real-time data retrieved from the SUSE Observability StackState platform.
- Simplifying Data Access: Abstract the complexity of StackState's native APIs (e.g., Time Travel, 4T Data Model) into simple, semantic functions that can be easily invoked by LLM tool-calling mechanisms.
- Data Normalization: Convert complex, technical identifiers (like component URNs, raw metric names, and proprietary health states) into standardized, natural language terms that an LLM can easily reason over.
- Enabling Automated Remediation: Define clear, action-oriented MCP endpoints (e.g., execute_runbook) that allow the AI agent to initiate automated operational workflows (e.g., restarts, scaling) after a diagnosis, closing the loop on observability.
Hackweek STEP
- Create a functional MCP endpoint exposing one (or more) tool(s) to answer queries like "What is the health of service X?") by fetching, normalizing, and returning live StackState data in an LLM-ready format.
Scope
- Implement read-only MCP server that can:
- Connect to a live SUSE Observability instance and authenticate (with API token)
- Use tools to fetch data for a specific component URN (e.g., current health state, metrics, possibly topology neighbors, ...).
- Normalize response fields (e.g., URN to "Service Name," health state DEVIATING to "Unhealthy", raw metrics).
- Return the data as a structured JSON payload compliant with the MCP specification.
Deliverables
- MCP Server v0.1 A running Golang MCP server with at least one tool.
- A README.md and a test script (e.g., curl commands or a simple notebook) showing how an AI agent would call the endpoint and the resulting JSON payload.
Outcome A functional and testable API endpoint that proves the core concept: translating complex StackState data into a simple, LLM-ready format. This provides the foundation for developing AI-driven diagnostics and automated remediation.
Resources
- https://www.honeycomb.io/blog/its-the-end-of-observability-as-we-know-it-and-i-feel-fine
- https://www.datadoghq.com/blog/datadog-remote-mcp-server
- https://modelcontextprotocol.io/specification/2025-06-18/index
- https://modelcontextprotocol.io/docs/develop/build-server
Basic implementation
- https://github.com/drutigliano19/suse-observability-mcp-server
Results
Successfully developed and delivered a fully functional SUSE Observability MCP Server that bridges language models with SUSE Observability's operational data. This project demonstrates how AI agents can perform intelligent troubleshooting and root cause analysis using structured access to real-time infrastructure data.
Example execution
issuefs: FUSE filesystem representing issues (e.g. JIRA) for the use with AI agents code-assistants by llansky3
Description
Creating a FUSE filesystem (issuefs) that mounts issues from various ticketing systems (Github, Jira, Bugzilla, Redmine) as files to your local file system.
And why this is good idea?
- User can use favorite command line tools to view and search the tickets from various sources
- User can use AI agents capabilities from your favorite IDE or cli to ask question about the issues, project or functionality while providing relevant tickets as context without extra work.
- User can use it during development of the new features when you let the AI agent to jump start the solution. The issuefs will give the AI agent the context (AI agents just read few more files) about the bug or requested features. No need for copying and pasting issues to user prompt or by using extra MCP tools to access the issues. These you can still do but this approach is on purpose different.

Goals
- Add Github issue support
- Proof the concept/approach by apply the approach on itself using Github issues for tracking and development of new features
- Add support for Bugzilla and Redmine using this approach in the process of doing it. Record a video of it.
- Clean-up and test the implementation and create some documentation
- Create a blog post about this approach
Resources
There is a prototype implementation here. This currently sort of works with JIRA only.
Song Search with CLAP by gcolangiuli
Description
Contrastive Language-Audio Pretraining (CLAP) is an open-source library that enables the training of a neural network on both Audio and Text descriptions, making it possible to search for Audio using a Text input. Several pre-trained models for song search are already available on huggingface

Goals
Evaluate how CLAP can be used for song searching and determine which types of queries yield the best results by developing a Minimum Viable Product (MVP) in Python. Based on the results of this MVP, future steps could include:
- Music Tagging;
- Free text search;
- Integration with an LLM (for example, with MCP or the OpenAI API) for music suggestions based on your own library.
The code for this project will be entirely written using AI to better explore and demonstrate AI capabilities.
Result
In this MVP we implemented:
- Async Song Analysis with Clap model
- Free Text Search of the songs
- Similar song search based on vector representation
- Containerised version with web interface
We also documented what went well and what can be improved in the use of AI.
You can have a look at the result here:
Future implementation can be related to performance improvement and stability of the analysis.
References
- CLAP: The main model being researched;
- huggingface: Pre-trained models for CLAP;
- Free Music Archive: Creative Commons songs that can be used for testing;
Bugzilla goes AI - Phase 1 by nwalter
Description
This project, Bugzilla goes AI, aims to boost developer productivity by creating an autonomous AI bug agent during Hackweek. The primary goal is to reduce the time employees spend triaging bugs by integrating Ollama to summarize issues, recommend next steps, and push focused daily reports to a Web Interface.
Goals
To reduce employee time spent on Bugzilla by implementing an AI tool that triages and summarizes bug reports, providing actionable recommendations to the team via Web Interface.
Project Charter
Description
Project Achievements during Hackweek
In this file you can read about what we achieved during Hackweek.
Liz - Prompt autocomplete by ftorchia
Description
Liz is the Rancher AI assistant for cluster operations.
Goals
We want to help users when sending new messages to Liz, by adding an autocomplete feature to complete their requests based on the context.
Example:
- User prompt: "Can you show me the list of p"
- Autocomplete suggestion: "Can you show me the list of p...od in local cluster?"
Example:
- User prompt: "Show me the logs of #rancher-"
- Chat console: It shows a drop-down widget, next to the # character, with the list of available pod names starting with "rancher-".
Technical Overview
- The AI agent should expose a new ws/autocomplete endpoint to proxy autocomplete messages to the LLM.
- The UI extension should be able to display prompt suggestions and allow users to apply the autocomplete to the Prompt via keyboard shortcuts.
Resources
Uyuni Saltboot rework by oholecek
Description
When Uyuni switched over to the containerized proxies we had to abandon salt based saltboot infrastructure we had before. Uyuni already had integration with a Cobbler provisioning server and saltboot infra was re-implemented on top of this Cobbler integration.
What was not obvious from the start was that Cobbler, having all it's features, woefully slow when dealing with saltboot size environments. We did some improvements in performance, introduced transactions, and generally tried to make this setup usable. However the underlying slowness remained.
Goals
This project is not something trying to invent new things, it is just finally implementing saltboot infrastructure directly with the Uyuni server core.
Instead of generating grub and pxelinux configurations by Cobbler for all thousands of systems and branches, we will provide a GET access point to retrieve grub or pxelinux file during the boot:
/saltboot/group/grub/$fqdn and similar for systems /saltboot/system/grub/$mac
Next we adapt our tftpd translator to query these points when asked for default or mac based config.
Lastly similar thing needs to be done on our apache server when HTTP UEFI boot is used.
Resources
Uyuni Health-check Grafana AI Troubleshooter by ygutierrez
Description
This project explores the feasibility of using the open-source Grafana LLM plugin to enhance the Uyuni Health-check tool with LLM capabilities. The idea is to integrate a chat-based "AI Troubleshooter" directly into existing dashboards, allowing users to ask natural-language questions about errors, anomalies, or performance issues.
Goals
- Investigate if and how the
grafana-llm-appplug-in can be used within the Uyuni Health-check tool. - Investigate if this plug-in can be used to query LLMs for troubleshooting scenarios.
- Evaluate support for local LLMs and external APIs through the plugin.
- Evaluate if and how the Uyuni MCP server could be integrated as another source of information.
Resources
Flaky Tests AI Finder for Uyuni and MLM Test Suites by oscar-barrios
Description
Our current Grafana dashboards provide a great overview of test suite health, including a panel for "Top failed tests." However, identifying which of these failures are due to legitimate bugs versus intermittent "flaky tests" is a manual, time-consuming process. These flaky tests erode trust in our test suites and slow down development.
This project aims to build a simple but powerful Python script that automates flaky test detection. The script will directly query our Prometheus instance for the historical data of each failed test, using the jenkins_build_test_case_failure_age metric. It will then format this data and send it to the Gemini API with a carefully crafted prompt, asking it to identify which tests show a flaky pattern.
The final output will be a clean JSON list of the most probable flaky tests, which can then be used to populate a new "Top Flaky Tests" panel in our existing Grafana test suite dashboard.
Goals
By the end of Hack Week, we aim to have a single, working Python script that:
- Connects to Prometheus and executes a query to fetch detailed test failure history.
- Processes the raw data into a format suitable for the Gemini API.
- Successfully calls the Gemini API with the data and a clear prompt.
- Parses the AI's response to extract a simple list of flaky tests.
- Saves the list to a JSON file that can be displayed in Grafana.
- New panel in our Dashboard listing the Flaky tests
Resources
- Jenkins Prometheus Exporter: https://github.com/uyuni-project/jenkins-exporter/
- Data Source: Our internal Prometheus server.
- Key Metric:
jenkins_build_test_case_failure_age{jobname, buildid, suite, case, status, failedsince}. - Existing Query for Reference:
count by (suite) (max_over_time(jenkins_build_test_case_failure_age{status=~"FAILED|REGRESSION", jobname="$jobname"}[$__range])). - AI Model: The Google Gemini API.
- Example about how to interact with Gemini API: https://github.com/srbarrios/FailTale/
- Visualization: Our internal Grafana Dashboard.
- Internal IaC: https://gitlab.suse.de/galaxy/infrastructure/-/tree/master/srv/salt/monitoring
Outcome
- Jenkins Flaky Test Detector: https://github.com/srbarrios/jenkins-flaky-tests-detector and its container
- IaC on MLM Team: https://gitlab.suse.de/galaxy/infrastructure/-/tree/master/srv/salt/monitoring/jenkinsflakytestsdetector?reftype=heads, https://gitlab.suse.de/galaxy/infrastructure/-/blob/master/srv/salt/monitoring/grafana/dashboards/flaky-tests.json?ref_type=heads, and others.
- Grafana Dashboard: https://grafana.mgr.suse.de/d/flaky-tests/flaky-tests-detection @ @ text
Move Uyuni Test Framework from Selenium to Playwright + AI by oscar-barrios
Description
This project aims to migrate the existing Uyuni Test Framework from Selenium to Playwright. The move will improve the stability, speed, and maintainability of our end-to-end tests by leveraging Playwright's modern features. We'll be rewriting the current Selenium code in Ruby to Playwright code in TypeScript, which includes updating the test framework runner, step definitions, and configurations. This is also necessary because we're moving from Cucumber Ruby to CucumberJS.
If you're still curious about the AI in the title, it was just a way to grab your attention. Thanks for your understanding.
Nah, let's be honest ![]() AI helped a lot to vibe code a good part of the Ruby methods of the Test framework, moving them to Typescript, along with the migration from Capybara to Playwright. I've been using "Cline" as plugin for WebStorm IDE, using Gemini API behind it.
AI helped a lot to vibe code a good part of the Ruby methods of the Test framework, moving them to Typescript, along with the migration from Capybara to Playwright. I've been using "Cline" as plugin for WebStorm IDE, using Gemini API behind it.
Goals
- Migrate Core tests including Onboarding of clients
- Improve test reliabillity: Measure and confirm a significant reduction of flakiness.
- Implement a robust framework: Establish a well-structured and reusable Playwright test framework using the CucumberJS
Resources
- Existing Uyuni Test Framework (Cucumber Ruby + Capybara + Selenium)
- My Template for CucumberJS + Playwright in TypeScript
- Started Hackweek Project
Uyuni read-only replica by cbosdonnat
Description
For now, there is no possible HA setup for Uyuni. The idea is to explore setting up a read-only shadow instance of an Uyuni and make it as useful as possible.
Possible things to look at:
- live sync of the database, probably using the WAL. Some of the tables may have to be skipped or some features disabled on the RO instance (taskomatic, PXT sessions…)
- Can we use a load balancer that routes read-only queries to either instance and the other to the RW one? For example, packages or PXE data can be served by both, the API GET requests too. The rest would be RW.
Goals
- Prepare a document explaining how to do it.
- PR with the needed code changes to support it
"what is it" file and directory analysis via MCP and local LLM, for console and KDE by rsimai
Description
Users sometimes wonder what files or directories they find on their local PC are good for. If they can't determine from the filename or metadata, there should an easy way to quickly analyze the content and at least guess the meaning. An LLM could help with that, through the use of a filesystem MCP and to-text-converters for typical file types. Ideally this is integrated into the desktop environment but works as well from a console. All data is processed locally or "on premise", no artifacts remain or leave the system.
Goals
- The user can run a command from the console, to check on a file or directory
- The filemanager contains the "analyze" feature within the context menu
- The local LLM could serve for other use cases where privacy matters
TBD
- Find or write capable one-shot and interactive MCP client
- Find or write simple+secure file access MCP server
- Create local LLM service with appropriate footprint, containerized
- Shell command with options
- KDE integration (Dolphin)
- Package
- Document
Resources
SUSE Observability MCP server by drutigliano
Description
The idea is to implement the SUSE Observability Model Context Protocol (MCP) Server as a specialized, middle-tier API designed to translate the complex, high-cardinality observability data from StackState (topology, metrics, and events) into highly structured, contextually rich, and LLM-ready snippets.
This MCP Server abstract the StackState APIs. Its primary function is to serve as a Tool/Function Calling target for AI agents. When an AI receives an alert or a user query (e.g., "What caused the outage?"), the AI calls an MCP Server endpoint. The server then fetches the relevant operational facts, summarizes them, normalizes technical identifiers (like URNs and raw metric names) into natural language concepts, and returns a concise JSON or YAML payload. This payload is then injected directly into the LLM's prompt, ensuring the final diagnosis or action is grounded in real-time, accurate SUSE Observability data, effectively minimizing hallucinations.
Goals
- Grounding AI Responses: Ensure that all AI diagnoses, root cause analyses, and action recommendations are strictly based on verifiable, real-time data retrieved from the SUSE Observability StackState platform.
- Simplifying Data Access: Abstract the complexity of StackState's native APIs (e.g., Time Travel, 4T Data Model) into simple, semantic functions that can be easily invoked by LLM tool-calling mechanisms.
- Data Normalization: Convert complex, technical identifiers (like component URNs, raw metric names, and proprietary health states) into standardized, natural language terms that an LLM can easily reason over.
- Enabling Automated Remediation: Define clear, action-oriented MCP endpoints (e.g., execute_runbook) that allow the AI agent to initiate automated operational workflows (e.g., restarts, scaling) after a diagnosis, closing the loop on observability.
Hackweek STEP
- Create a functional MCP endpoint exposing one (or more) tool(s) to answer queries like "What is the health of service X?") by fetching, normalizing, and returning live StackState data in an LLM-ready format.
Scope
- Implement read-only MCP server that can:
- Connect to a live SUSE Observability instance and authenticate (with API token)
- Use tools to fetch data for a specific component URN (e.g., current health state, metrics, possibly topology neighbors, ...).
- Normalize response fields (e.g., URN to "Service Name," health state DEVIATING to "Unhealthy", raw metrics).
- Return the data as a structured JSON payload compliant with the MCP specification.
Deliverables
- MCP Server v0.1 A running Golang MCP server with at least one tool.
- A README.md and a test script (e.g., curl commands or a simple notebook) showing how an AI agent would call the endpoint and the resulting JSON payload.
Outcome A functional and testable API endpoint that proves the core concept: translating complex StackState data into a simple, LLM-ready format. This provides the foundation for developing AI-driven diagnostics and automated remediation.
Resources
- https://www.honeycomb.io/blog/its-the-end-of-observability-as-we-know-it-and-i-feel-fine
- https://www.datadoghq.com/blog/datadog-remote-mcp-server
- https://modelcontextprotocol.io/specification/2025-06-18/index
- https://modelcontextprotocol.io/docs/develop/build-server
Basic implementation
- https://github.com/drutigliano19/suse-observability-mcp-server
Results
Successfully developed and delivered a fully functional SUSE Observability MCP Server that bridges language models with SUSE Observability's operational data. This project demonstrates how AI agents can perform intelligent troubleshooting and root cause analysis using structured access to real-time infrastructure data.
Example execution
Docs Navigator MCP: SUSE Edition by mackenzie.techdocs

Description
Docs Navigator MCP: SUSE Edition is an AI-powered documentation navigator that makes finding information across SUSE, Rancher, K3s, and RKE2 documentation effortless. Built as a Model Context Protocol (MCP) server, it enables semantic search, intelligent Q&A, and documentation summarization using 100% open-source AI models (no API keys required!). The project also allows you to bring your own keys from Anthropic and Open AI for parallel processing.
Goals
- [ X ] Build functional MCP server with documentation tools
- [ X ] Implement semantic search with vector embeddings
- [ X ] Create user-friendly web interface
- [ X ] Optimize indexing performance (parallel processing)
- [ X ] Add SUSE branding and polish UX
- [ X ] Stretch Goal: Add more documentation sources
- [ X ] Stretch Goal: Implement document change detection for auto-updates
Coming Soon!
- Community Feedback: Test with real users and gather improvement suggestions
Resources
- Repository: Docs Navigator MCP: SUSE Edition GitHub
- UI Demo: Live UI Demo of Docs Navigator MCP: SUSE Edition
Multi-agent AI assistant for Linux troubleshooting by doreilly
Description
Explore multi-agent architecture as a way to avoid MCP context rot.
Having one agent with many tools bloats the context with low-level details about tool descriptions, parameter schemas etc which hurts LLM performance. Instead have many specialised agents, each with just the tools it needs for its role. A top level supervisor agent takes the user prompt and delegates to appropriate sub-agents.
Goals
Create an AI assistant with some sub-agents that are specialists at troubleshooting Linux subsystems, e.g. systemd, selinux, firewalld etc. The agents can get information from the system by implementing their own tools with simple function calls, or use tools from MCP servers, e.g. a systemd-agent can use tools from systemd-mcp.
Example prompts/responses:
user$ the system seems slow
assistant$ process foo with pid 12345 is using 1000% cpu ...

user$ I can't connect to the apache webserver
assistant$ the firewall is blocking http ... you can open the port with firewall-cmd --add-port ...
Resources
Language Python. The Python ADK is more mature than Golang.
https://google.github.io/adk-docs/
https://github.com/djoreilly/linux-helper
MCP Trace Suite by r1chard-lyu
Description
This project plans to create an MCP Trace Suite, a system that consolidates commonly used Linux debugging tools such as bpftrace, perf, and ftrace.
The suite is implemented as an MCP Server. This architecture allows an AI agent to leverage the server to diagnose Linux issues and perform targeted system debugging by remotely executing and retrieving tracing data from these powerful tools.
- Repo: https://github.com/r1chard-lyu/systracesuite
- Demo: Slides
Goals
Build an MCP Server that can integrate various Linux debugging and tracing tools, including bpftrace, perf, ftrace, strace, and others, with support for future expansion of additional tools.
Perform testing by intentionally creating bugs or issues that impact system performance, allowing an AI agent to analyze the root cause and identify the underlying problem.
Resources
- Gemini CLI: https://geminicli.com/
- eBPF: https://ebpf.io/
- bpftrace: https://github.com/bpftrace/bpftrace/
- perf: https://perfwiki.github.io/main/
- ftrace: https://github.com/r1chard-lyu/tracium/
SUSE Observability MCP server by drutigliano
Description
The idea is to implement the SUSE Observability Model Context Protocol (MCP) Server as a specialized, middle-tier API designed to translate the complex, high-cardinality observability data from StackState (topology, metrics, and events) into highly structured, contextually rich, and LLM-ready snippets.
This MCP Server abstract the StackState APIs. Its primary function is to serve as a Tool/Function Calling target for AI agents. When an AI receives an alert or a user query (e.g., "What caused the outage?"), the AI calls an MCP Server endpoint. The server then fetches the relevant operational facts, summarizes them, normalizes technical identifiers (like URNs and raw metric names) into natural language concepts, and returns a concise JSON or YAML payload. This payload is then injected directly into the LLM's prompt, ensuring the final diagnosis or action is grounded in real-time, accurate SUSE Observability data, effectively minimizing hallucinations.
Goals
- Grounding AI Responses: Ensure that all AI diagnoses, root cause analyses, and action recommendations are strictly based on verifiable, real-time data retrieved from the SUSE Observability StackState platform.
- Simplifying Data Access: Abstract the complexity of StackState's native APIs (e.g., Time Travel, 4T Data Model) into simple, semantic functions that can be easily invoked by LLM tool-calling mechanisms.
- Data Normalization: Convert complex, technical identifiers (like component URNs, raw metric names, and proprietary health states) into standardized, natural language terms that an LLM can easily reason over.
- Enabling Automated Remediation: Define clear, action-oriented MCP endpoints (e.g., execute_runbook) that allow the AI agent to initiate automated operational workflows (e.g., restarts, scaling) after a diagnosis, closing the loop on observability.
Hackweek STEP
- Create a functional MCP endpoint exposing one (or more) tool(s) to answer queries like "What is the health of service X?") by fetching, normalizing, and returning live StackState data in an LLM-ready format.
Scope
- Implement read-only MCP server that can:
- Connect to a live SUSE Observability instance and authenticate (with API token)
- Use tools to fetch data for a specific component URN (e.g., current health state, metrics, possibly topology neighbors, ...).
- Normalize response fields (e.g., URN to "Service Name," health state DEVIATING to "Unhealthy", raw metrics).
- Return the data as a structured JSON payload compliant with the MCP specification.
Deliverables
- MCP Server v0.1 A running Golang MCP server with at least one tool.
- A README.md and a test script (e.g., curl commands or a simple notebook) showing how an AI agent would call the endpoint and the resulting JSON payload.
Outcome A functional and testable API endpoint that proves the core concept: translating complex StackState data into a simple, LLM-ready format. This provides the foundation for developing AI-driven diagnostics and automated remediation.
Resources
- https://www.honeycomb.io/blog/its-the-end-of-observability-as-we-know-it-and-i-feel-fine
- https://www.datadoghq.com/blog/datadog-remote-mcp-server
- https://modelcontextprotocol.io/specification/2025-06-18/index
- https://modelcontextprotocol.io/docs/develop/build-server
Basic implementation
- https://github.com/drutigliano19/suse-observability-mcp-server
Results
Successfully developed and delivered a fully functional SUSE Observability MCP Server that bridges language models with SUSE Observability's operational data. This project demonstrates how AI agents can perform intelligent troubleshooting and root cause analysis using structured access to real-time infrastructure data.
Example execution
The Agentic Rancher Experiment: Do Androids Dream of Electric Cattle? by moio
Rancher is a beast of a codebase. Let's investigate if the new 2025 generation of GitHub Autonomous Coding Agents and Copilot Workspaces can actually tame it. 
The Plan
Create a sandbox GitHub Organization, clone in key Rancher repositories, and let the AI loose to see if it can handle real-world enterprise OSS maintenance - or if it just hallucinates new breeds of Kubernetes resources!
Specifically, throw "Agentic Coders" some typical tasks in a complex, long-lived open-source project, such as:
❥ The Grunt Work: generate missing GoDocs, unit tests, and refactorings. Rebase PRs.
❥ The Complex Stuff: fix actual (historical) bugs and feature requests to see if they can traverse the complexity without (too much) human hand-holding.
❥ Hunting Down Gaps: find areas lacking in docs, areas of improvement in code, dependency bumps, and so on.
If time allows, also experiment with Model Context Protocol (MCP) to give agents context on our specific build pipelines and CI/CD logs.
Why?
We know AI can write "Hello World." and also moderately complex programs from a green field. But can it rebase a 3-month-old PR with conflicts in rancher/rancher? I want to find the breaking point of current AI agents to determine if and how they can help us to reduce our technical debt, work faster and better. At the same time, find out about pitfalls and shortcomings.
The CONCLUSION!!!
A ![]() State of the Union
State of the Union ![]() document was compiled to summarize lessons learned this week. For more gory details, just read on the diary below!
document was compiled to summarize lessons learned this week. For more gory details, just read on the diary below! ![]()