Project Description
Dashboard to aggregate publicly available open source date and transform, analyse, forecast factors affecting water conflicts.
Full disclosure: This project was initially done as part of my University course - Data Systems Project. It was presented to TNO (Nederlandse Organisatie voor Toegepast Natuurwetenschappelijk Onderzoek) - Military division. Reason I took this project was it was exciting ML/AI POC for me.
Also believed this would actually help prevent conflicts and provide aid as oppose to somehow use it maliciously. This project is 2 years old. TNO did not provide any of their data or expertise and do not own this project.
Current state:
FE: React BE: Python / Flask
- Project is more than 1.5 years old.
- UI have quite alot of hardcoded data.
- There are some buggy UI issues as well.
- Backend could be broken
Goal for this Hackweek
github (Private): https://github.com/Shavindra/TNO
I like to keep things very simple and not overdo anything.
- Update packages
- Fix UI bugs.
- Update Python backend
Then work one of the following
- Integrate some data sources properly.
- Least 1/2 API endpoints working on a basic level.
- Any other suggestions?
Resources
https://www.wri.org/insights/we-predicted-where-violent-conflicts-will-occur-2020-water-often-factor

Looking for hackers with the skills:
ai machinelearning artificial-intelligence water conflicts dashboard reactjs react
This project is part of:
Hack Week 21
Activity
Comments
Be the first to comment!
Similar Projects
Liz - Prompt autocomplete by ftorchia
Description
Liz is the Rancher AI assistant for cluster operations.
Goals
We want to help users when sending new messages to Liz, by adding an autocomplete feature to complete their requests based on the context.
Example:
- User prompt: "Can you show me the list of p"
- Autocomplete suggestion: "Can you show me the list of p...od in local cluster?"
Example:
- User prompt: "Show me the logs of #rancher-"
- Chat console: It shows a drop-down widget, next to the # character, with the list of available pod names starting with "rancher-".
Technical Overview
- The AI agent should expose a new ws/autocomplete endpoint to proxy autocomplete messages to the LLM.
- The UI extension should be able to display prompt suggestions and allow users to apply the autocomplete to the Prompt via keyboard shortcuts.
Resources
MCP Server for SCC by digitaltomm
Description
Provide an MCP Server implementation for customers to access data on scc.suse.com via MCP protocol. The core benefit of this MCP interface is that it has direct (read) access to customer data in SCC, so the AI agent gets enhanced knowledge about individual customer data, like subscriptions, orders and registered systems.
Architecture
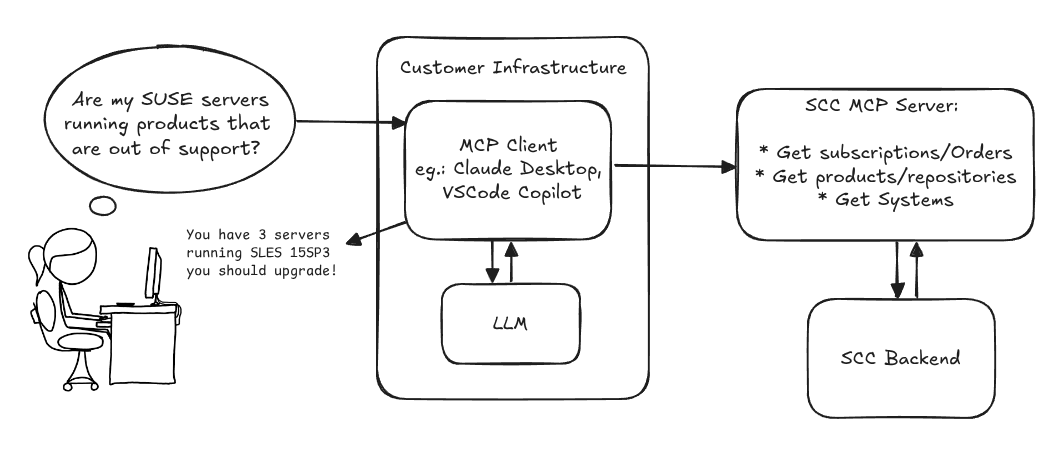
Goals
We want to demonstrate a proof of concept to connect to the SCC MCP server with any AI agent, for example gemini-cli or codex. Enabling the user to ask questions regarding their SCC inventory.
For this Hackweek, we target that users get proper responses to these example questions:
- Which of my currently active systems are running products that are out of support?
- Do I have ready to use registration codes for SLES?
- What are the latest 5 released patches for SLES 15 SP6? Output as a list with release date, patch name, affected package names and fixed CVEs.
- Which versions of kernel-default are available on SLES 15 SP6?
Technical Notes
Similar to the organization APIs, this can expose to customers data about their subscriptions, orders, systems and products. Authentication should be done by organization credentials, similar to what needs to be provided to RMT/MLM. Customers can connect to the SCC MCP server from their own MCP-compatible client and Large Language Model (LLM), so no third party is involved.
Milestones
[x] Basic MCP API setup
  MCP endpoints
  [x] Products / Repositories
  [x] Subscriptions / Orders
  [x] Systems
  [x] Packages
[x] Document usage with Gemini CLI, Codex
Resources
Gemini CLI setup:
~/.gemini/settings.json:
Flaky Tests AI Finder for Uyuni and MLM Test Suites by oscar-barrios
Description
Our current Grafana dashboards provide a great overview of test suite health, including a panel for "Top failed tests." However, identifying which of these failures are due to legitimate bugs versus intermittent "flaky tests" is a manual, time-consuming process. These flaky tests erode trust in our test suites and slow down development.
This project aims to build a simple but powerful Python script that automates flaky test detection. The script will directly query our Prometheus instance for the historical data of each failed test, using the jenkins_build_test_case_failure_age metric. It will then format this data and send it to the Gemini API with a carefully crafted prompt, asking it to identify which tests show a flaky pattern.
The final output will be a clean JSON list of the most probable flaky tests, which can then be used to populate a new "Top Flaky Tests" panel in our existing Grafana test suite dashboard.
Goals
By the end of Hack Week, we aim to have a single, working Python script that:
- Connects to Prometheus and executes a query to fetch detailed test failure history.
- Processes the raw data into a format suitable for the Gemini API.
- Successfully calls the Gemini API with the data and a clear prompt.
- Parses the AI's response to extract a simple list of flaky tests.
- Saves the list to a JSON file that can be displayed in Grafana.
- New panel in our Dashboard listing the Flaky tests
Resources
- Jenkins Prometheus Exporter: https://github.com/uyuni-project/jenkins-exporter/
- Data Source: Our internal Prometheus server.
- Key Metric:
jenkins_build_test_case_failure_age{jobname, buildid, suite, case, status, failedsince}. - Existing Query for Reference:
count by (suite) (max_over_time(jenkins_build_test_case_failure_age{status=~"FAILED|REGRESSION", jobname="$jobname"}[$__range])). - AI Model: The Google Gemini API.
- Example about how to interact with Gemini API: https://github.com/srbarrios/FailTale/
- Visualization: Our internal Grafana Dashboard.
- Internal IaC: https://gitlab.suse.de/galaxy/infrastructure/-/tree/master/srv/salt/monitoring
Outcome
- Jenkins Flaky Test Detector: https://github.com/srbarrios/jenkins-flaky-tests-detector and its container
- IaC on MLM Team: https://gitlab.suse.de/galaxy/infrastructure/-/tree/master/srv/salt/monitoring/jenkinsflakytestsdetector?reftype=heads, https://gitlab.suse.de/galaxy/infrastructure/-/blob/master/srv/salt/monitoring/grafana/dashboards/flaky-tests.json?ref_type=heads, and others.
- Grafana Dashboard: https://grafana.mgr.suse.de/d/flaky-tests/flaky-tests-detection @ @ text
Update M2Crypto by mcepl
There are couple of projects I work on, which need my attention and putting them to shape:
Goal for this Hackweek
- Put M2Crypto into better shape (most issues closed, all pull requests processed)
- More fun to learn jujutsu
- Play more with Gemini, how much it help (or not).
- Perhaps, also (just slightly related), help to fix vis to work with LuaJIT, particularly to make vis-lspc working.
Kubernetes-Based ML Lifecycle Automation by lmiranda
Description
This project aims to build a complete end-to-end Machine Learning pipeline running entirely on Kubernetes, using Go, and containerized ML components.
The pipeline will automate the lifecycle of a machine learning model, including:
- Data ingestion/collection
- Model training as a Kubernetes Job
- Model artifact storage in an S3-compatible registry (e.g. Minio)
- A Go-based deployment controller that automatically deploys new model versions to Kubernetes using Rancher
- A lightweight inference service that loads and serves the latest model
- Monitoring of model performance and service health through Prometheus/Grafana
The outcome is a working prototype of an MLOps workflow that demonstrates how AI workloads can be trained, versioned, deployed, and monitored using the Kubernetes ecosystem.
Goals
By the end of Hack Week, the project should:
Produce a fully functional ML pipeline running on Kubernetes with:
- Data collection job
- Training job container
- Storage and versioning of trained models
- Automated deployment of new model versions
- Model inference API service
- Basic monitoring dashboards
Showcase a Go-based deployment automation component, which scans the model registry and automatically generates & applies Kubernetes manifests for new model versions.
Enable continuous improvement by making the system modular and extensible (e.g., additional models, metrics, autoscaling, or drift detection can be added later).
Prepare a short demo explaining the end-to-end process and how new models flow through the system.
Resources
Updates
- Training pipeline and datasets
- Inference Service py
Song Search with CLAP by gcolangiuli
Description
Contrastive Language-Audio Pretraining (CLAP) is an open-source library that enables the training of a neural network on both Audio and Text descriptions, making it possible to search for Audio using a Text input. Several pre-trained models for song search are already available on huggingface

Goals
Evaluate how CLAP can be used for song searching and determine which types of queries yield the best results by developing a Minimum Viable Product (MVP) in Python. Based on the results of this MVP, future steps could include:
- Music Tagging;
- Free text search;
- Integration with an LLM (for example, with MCP or the OpenAI API) for music suggestions based on your own library.
The code for this project will be entirely written using AI to better explore and demonstrate AI capabilities.
Result
In this MVP we implemented:
- Async Song Analysis with Clap model
- Free Text Search of the songs
- Similar song search based on vector representation
- Containerised version with web interface
We also documented what went well and what can be improved in the use of AI.
You can have a look at the result here:
Future implementation can be related to performance improvement and stability of the analysis.
References
- CLAP: The main model being researched;
- huggingface: Pre-trained models for CLAP;
- Free Music Archive: Creative Commons songs that can be used for testing;
SUSE Observability MCP server by drutigliano
Description
The idea is to implement the SUSE Observability Model Context Protocol (MCP) Server as a specialized, middle-tier API designed to translate the complex, high-cardinality observability data from StackState (topology, metrics, and events) into highly structured, contextually rich, and LLM-ready snippets.
This MCP Server abstract the StackState APIs. Its primary function is to serve as a Tool/Function Calling target for AI agents. When an AI receives an alert or a user query (e.g., "What caused the outage?"), the AI calls an MCP Server endpoint. The server then fetches the relevant operational facts, summarizes them, normalizes technical identifiers (like URNs and raw metric names) into natural language concepts, and returns a concise JSON or YAML payload. This payload is then injected directly into the LLM's prompt, ensuring the final diagnosis or action is grounded in real-time, accurate SUSE Observability data, effectively minimizing hallucinations.
Goals
- Grounding AI Responses: Ensure that all AI diagnoses, root cause analyses, and action recommendations are strictly based on verifiable, real-time data retrieved from the SUSE Observability StackState platform.
- Simplifying Data Access: Abstract the complexity of StackState's native APIs (e.g., Time Travel, 4T Data Model) into simple, semantic functions that can be easily invoked by LLM tool-calling mechanisms.
- Data Normalization: Convert complex, technical identifiers (like component URNs, raw metric names, and proprietary health states) into standardized, natural language terms that an LLM can easily reason over.
- Enabling Automated Remediation: Define clear, action-oriented MCP endpoints (e.g., execute_runbook) that allow the AI agent to initiate automated operational workflows (e.g., restarts, scaling) after a diagnosis, closing the loop on observability.
Hackweek STEP
- Create a functional MCP endpoint exposing one (or more) tool(s) to answer queries like "What is the health of service X?") by fetching, normalizing, and returning live StackState data in an LLM-ready format.
Scope
- Implement read-only MCP server that can:
- Connect to a live SUSE Observability instance and authenticate (with API token)
- Use tools to fetch data for a specific component URN (e.g., current health state, metrics, possibly topology neighbors, ...).
- Normalize response fields (e.g., URN to "Service Name," health state DEVIATING to "Unhealthy", raw metrics).
- Return the data as a structured JSON payload compliant with the MCP specification.
Deliverables
- MCP Server v0.1 A running Golang MCP server with at least one tool.
- A README.md and a test script (e.g., curl commands or a simple notebook) showing how an AI agent would call the endpoint and the resulting JSON payload.
Outcome A functional and testable API endpoint that proves the core concept: translating complex StackState data into a simple, LLM-ready format. This provides the foundation for developing AI-driven diagnostics and automated remediation.
Resources
- https://www.honeycomb.io/blog/its-the-end-of-observability-as-we-know-it-and-i-feel-fine
- https://www.datadoghq.com/blog/datadog-remote-mcp-server
- https://modelcontextprotocol.io/specification/2025-06-18/index
- https://modelcontextprotocol.io/docs/develop/build-server
Basic implementation
- https://github.com/drutigliano19/suse-observability-mcp-server
Results
Successfully developed and delivered a fully functional SUSE Observability MCP Server that bridges language models with SUSE Observability's operational data. This project demonstrates how AI agents can perform intelligent troubleshooting and root cause analysis using structured access to real-time infrastructure data.
Example execution
AI-Powered Unit Test Automation for Agama by joseivanlopez
The Agama project is a multi-language Linux installer that leverages the distinct strengths of several key technologies:
- Rust: Used for the back-end services and the core HTTP API, providing performance and safety.
- TypeScript (React/PatternFly): Powers the modern web user interface (UI), ensuring a consistent and responsive user experience.
- Ruby: Integrates existing, robust YaST libraries (e.g.,
yast-storage-ng) to reuse established functionality.
The Problem: Testing Overhead
Developing and maintaining code across these three languages requires a significant, tedious effort in writing, reviewing, and updating unit tests for each component. This high cost of testing is a drain on developer resources and can slow down the project's evolution.
The Solution: AI-Driven Automation
This project aims to eliminate the manual overhead of unit testing by exploring and integrating AI-driven code generation tools. We will investigate how AI can:
- Automatically generate new unit tests as code is developed.
- Intelligently correct and update existing unit tests when the application code changes.
By automating this crucial but monotonous task, we can free developers to focus on feature implementation and significantly improve the speed and maintainability of the Agama codebase.
Goals
- Proof of Concept: Successfully integrate and demonstrate an authorized AI tool (e.g.,
gemini-cli) to automatically generate unit tests. - Workflow Integration: Define and document a new unit test automation workflow that seamlessly integrates the selected AI tool into the existing Agama development pipeline.
- Knowledge Sharing: Establish a set of best practices for using AI in code generation, sharing the learned expertise with the broader team.
Contribution & Resources
We are seeking contributors interested in AI-powered development and improving developer efficiency. Whether you have previous experience with code generation tools or are eager to learn, your participation is highly valuable.
If you want to dive deep into AI for software quality, please reach out and join the effort!
- Authorized AI Tools: Tools supported by SUSE (e.g.,
gemini-cli) - Focus Areas: Rust, TypeScript, and Ruby components within the Agama project.
Interesting Links