an invention by cbosdonnat
Project Description
A supportconfig provides a lot of files and data from the system, but it is often hard to spot the real issue in it. The idea of this project is to get machine-readable output for the supportconfig data and analyze them.
Then we would try to provide hints using the tool about what is wrong.
The name of this tool is: uyuni-health-check.
GitHub repository: https://github.com/uyuni-project/poc-uyuni-health-check
Summary:
- Research about machine learning log anomaly detectors: few alternatives out there.
- Getting custom metrics for Salt and Uyuni via prometheus exporter from live server.
- Setting up Loki to process relevant Uyuni logs from live server.
- Allow data visualization with Grafana.
- Really easy-to-use CLI tool to run "health checks" and get feedback.
Details:
- Grafana, Loki, Uyuni prometheus exporter and all other components run on "containers"
- The containers run on the Uyuni server. "podman" is required on the server.
- CLI tool takes care of building and deploying the "container" image to the server, collect the metrics and provide output on the command line.
- Prometheus / Grafana expose containers metrics.
Goals for Hackweek #23
- Enhance and collect more Uyuni / Salt metrics.
- Use "supportconfig" as source for logs/metrics instead of live server.
Achievements during HW #23
- ...
Goals for Hackweek #22
- Improve CLI and performance.
- Fix memory leak on "uyuni-health-exporter".
- Complete automated deployment of Loki and other containers.
Achievements during HW #22:
- Fix memory leak on uyuni-health-exporter.
- Fix python packaging and installation.
- Deploy grafana and prometheus dashboard.
- Fix loki and promtail deployments.
- Run all containers in the same POD.
- Unify console logging across deployment functions.
- More friendly CLI with new functions.
- Containers are not wiped by default after executions.
- Minor and cosmetic changes.
- Update README.md to reflect latest changes
Goals for this Hackweek #21
- Getting a machine readable version of supportconfig
- First analysis and tweaking


Looking for hackers with the skills:
supportconfig analysis tool dashboard monitoring grafana loki prometheus python3 uyuni susemanager
This project is part of:
Hack Week 21 Hack Week 22 Hack Week 23
Activity
Comments
-

almost 3 years ago by PSuarezHernandez | Reply
I've updated project description to reflect latest changes after Hackweek 22!
-
over 2 years ago by PSuarezHernandez | Reply
Let's keep hacking on this project during upcoming Hackweek 23!
Similar Projects
SUSE Health Check Tools by roseswe
SUSE HC Tools Overview
A collection of tools written in Bash or Go 1.24++ to make life easier with handling of a bunch of tar.xz balls created by supportconfig.
Background: For SUSE HC we receive a bunch of supportconfig tar balls to check them for misconfiguration, areas for improvement or future changes.
Main focus on these HC are High Availability (pacemaker), SLES itself and SAP workloads, esp. around the SUSE best practices.
Goals
- Overall improvement of the tools
- Adding new collectors
- Add support for SLES16
Resources
csv2xls* example.sh go.mod listprodids.txt sumtext* trails.go README.md csv2xls.go exceltest.go go.sum m.sh* sumtext.go vercheck.py* config.ini csvfiles/ getrpm* listprodids* rpmdate.sh* sumxls* verdriver* credtest.go example.py getrpm.go listprodids.go sccfixer.sh* sumxls.go verdriver.go
docollall.sh* extracthtml.go gethostnamectl* go.sum numastat.go cpuvul* extractcluster.go firmwarebug* gethostnamectl.go m.sh* numastattest.go cpuvul.go extracthtml* firmwarebug.go go.mod numastat* xtr_cib.sh*
$ getrpm -r pacemaker
>> Product ID: 2795 (SUSE Linux Enterprise Server for SAP Applications 15 SP7 x86_64), RPM Name:
+--------------+----------------------------+--------+--------------+--------------------+
| Package Name | Version                    | Arch   | Release      | Repository         |
+--------------+----------------------------+--------+--------------+--------------------+
| pacemaker    | 2.1.10+20250718.fdf796ebc8 | x86_64 | 150700.3.3.1 | sle-ha/15.7/x86_64 |
| pacemaker    | 2.1.9+20250410.471584e6a2  | x86_64 | 150700.1.9   | sle-ha/15.7/x86_64 |
+--------------+----------------------------+--------+--------------+--------------------+
Total packages found: 2
Is SUSE Trending? Popularity and Developer Sentiment Insight Using Native AI Capabilities by terezacerna
Description
This project aims to explore the popularity and developer sentiment around SUSE and its technologies compared to Red Hat and their technologies. Using publicly available data sources, I will analyze search trends, developer preferences, repository activity, and media presence. The final outcome will be an interactive Power BI dashboard that provides insights into how SUSE is perceived and discussed across the web and among developers.
Goals
- Assess the popularity of SUSE products and brand compared to Red Hat using Google Trends.
- Analyze developer satisfaction and usage trends from the Stack Overflow Developer Survey.
- Use the GitHub API to compare SUSE and Red Hat repositories in terms of stars, forks, contributors, and issue activity.
- Perform sentiment analysis on GitHub issue comments to measure community tone and engagement using built-in Copilot capabilities.
- Perform sentiment analysis on Reddit comments related to SUSE technologies using built-in Copilot capabilities.
- Use Gnews.io to track and compare the volume of news articles mentioning SUSE and Red Hat technologies.
- Test the integration of Copilot (AI) within Power BI for enhanced data analysis and visualization.
- Deliver a comprehensive Power BI report summarizing findings and insights.
- Test the full potential of Power BI, including its AI features and native language Q&A.
Resources
- Google Trends: Web scraping for search popularity data
- Stack Overflow Developer Survey: For technology popularity and satisfaction comparison
- GitHub API: For repository data (stars, forks, contributors, issues, comments).
- Gnews.io API: For article volume and mentions analysis.
- Reddit: SUSE related topics with comments.
Flaky Tests AI Finder for Uyuni and MLM Test Suites by oscar-barrios
Description
Our current Grafana dashboards provide a great overview of test suite health, including a panel for "Top failed tests." However, identifying which of these failures are due to legitimate bugs versus intermittent "flaky tests" is a manual, time-consuming process. These flaky tests erode trust in our test suites and slow down development.
This project aims to build a simple but powerful Python script that automates flaky test detection. The script will directly query our Prometheus instance for the historical data of each failed test, using the jenkins_build_test_case_failure_age metric. It will then format this data and send it to the Gemini API with a carefully crafted prompt, asking it to identify which tests show a flaky pattern.
The final output will be a clean JSON list of the most probable flaky tests, which can then be used to populate a new "Top Flaky Tests" panel in our existing Grafana test suite dashboard.
Goals
By the end of Hack Week, we aim to have a single, working Python script that:
- Connects to Prometheus and executes a query to fetch detailed test failure history.
- Processes the raw data into a format suitable for the Gemini API.
- Successfully calls the Gemini API with the data and a clear prompt.
- Parses the AI's response to extract a simple list of flaky tests.
- Saves the list to a JSON file that can be displayed in Grafana.
- New panel in our Dashboard listing the Flaky tests
Resources
- Jenkins Prometheus Exporter: https://github.com/uyuni-project/jenkins-exporter/
- Data Source: Our internal Prometheus server.
- Key Metric:
jenkins_build_test_case_failure_age{jobname, buildid, suite, case, status, failedsince}. - Existing Query for Reference:
count by (suite) (max_over_time(jenkins_build_test_case_failure_age{status=~"FAILED|REGRESSION", jobname="$jobname"}[$__range])). - AI Model: The Google Gemini API.
- Example about how to interact with Gemini API: https://github.com/srbarrios/FailTale/
- Visualization: Our internal Grafana Dashboard.
- Internal IaC: https://gitlab.suse.de/galaxy/infrastructure/-/tree/master/srv/salt/monitoring
Outcome
- Jenkins Flaky Test Detector: https://github.com/srbarrios/jenkins-flaky-tests-detector and its container
- IaC on MLM Team: https://gitlab.suse.de/galaxy/infrastructure/-/tree/master/srv/salt/monitoring/jenkinsflakytestsdetector?reftype=heads, https://gitlab.suse.de/galaxy/infrastructure/-/blob/master/srv/salt/monitoring/grafana/dashboards/flaky-tests.json?ref_type=heads, and others.
- Grafana Dashboard: https://grafana.mgr.suse.de/d/flaky-tests/flaky-tests-detection @ @ text
Uyuni Health-check Grafana AI Troubleshooter by ygutierrez
Description
This project explores the feasibility of using the open-source Grafana LLM plugin to enhance the Uyuni Health-check tool with LLM capabilities. The idea is to integrate a chat-based "AI Troubleshooter" directly into existing dashboards, allowing users to ask natural-language questions about errors, anomalies, or performance issues.
Goals
- Investigate if and how the
grafana-llm-appplug-in can be used within the Uyuni Health-check tool. - Investigate if this plug-in can be used to query LLMs for troubleshooting scenarios.
- Evaluate support for local LLMs and external APIs through the plugin.
- Evaluate if and how the Uyuni MCP server could be integrated as another source of information.
Resources
Flaky Tests AI Finder for Uyuni and MLM Test Suites by oscar-barrios
Description
Our current Grafana dashboards provide a great overview of test suite health, including a panel for "Top failed tests." However, identifying which of these failures are due to legitimate bugs versus intermittent "flaky tests" is a manual, time-consuming process. These flaky tests erode trust in our test suites and slow down development.
This project aims to build a simple but powerful Python script that automates flaky test detection. The script will directly query our Prometheus instance for the historical data of each failed test, using the jenkins_build_test_case_failure_age metric. It will then format this data and send it to the Gemini API with a carefully crafted prompt, asking it to identify which tests show a flaky pattern.
The final output will be a clean JSON list of the most probable flaky tests, which can then be used to populate a new "Top Flaky Tests" panel in our existing Grafana test suite dashboard.
Goals
By the end of Hack Week, we aim to have a single, working Python script that:
- Connects to Prometheus and executes a query to fetch detailed test failure history.
- Processes the raw data into a format suitable for the Gemini API.
- Successfully calls the Gemini API with the data and a clear prompt.
- Parses the AI's response to extract a simple list of flaky tests.
- Saves the list to a JSON file that can be displayed in Grafana.
- New panel in our Dashboard listing the Flaky tests
Resources
- Jenkins Prometheus Exporter: https://github.com/uyuni-project/jenkins-exporter/
- Data Source: Our internal Prometheus server.
- Key Metric:
jenkins_build_test_case_failure_age{jobname, buildid, suite, case, status, failedsince}. - Existing Query for Reference:
count by (suite) (max_over_time(jenkins_build_test_case_failure_age{status=~"FAILED|REGRESSION", jobname="$jobname"}[$__range])). - AI Model: The Google Gemini API.
- Example about how to interact with Gemini API: https://github.com/srbarrios/FailTale/
- Visualization: Our internal Grafana Dashboard.
- Internal IaC: https://gitlab.suse.de/galaxy/infrastructure/-/tree/master/srv/salt/monitoring
Outcome
- Jenkins Flaky Test Detector: https://github.com/srbarrios/jenkins-flaky-tests-detector and its container
- IaC on MLM Team: https://gitlab.suse.de/galaxy/infrastructure/-/tree/master/srv/salt/monitoring/jenkinsflakytestsdetector?reftype=heads, https://gitlab.suse.de/galaxy/infrastructure/-/blob/master/srv/salt/monitoring/grafana/dashboards/flaky-tests.json?ref_type=heads, and others.
- Grafana Dashboard: https://grafana.mgr.suse.de/d/flaky-tests/flaky-tests-detection @ @ text
mgr-ansible-ssh - Intelligent, Lightweight CLI for Distributed Remote Execution by deve5h
Description
By the end of Hack Week, the target will be to deliver a minimal functional version 1 (MVP) of a custom command-line tool named mgr-ansible-ssh (a unified wrapper for BOTH ad-hoc shell & playbooks) that allows operators to:
- Execute arbitrary shell commands on thousand of remote machines simultaneously using Ansible Runner with artifacts saved locally.
- Pass runtime options such as inventory file, remote command string/ playbook execution, parallel forks, limits, dry-run mode, or no-std-ansible-output.
- Leverage existing SSH trust relationships without additional setup.
- Provide a clean, intuitive CLI interface with --help for ease of use. It should provide consistent UX & CI-friendly interface.
- Establish a foundation that can later be extended with advanced features such as logging, grouping, interactive shell mode, safe-command checks, and parallel execution tuning.
The MVP should enable day-to-day operations to efficiently target thousands of machines with a single, consistent interface.
Goals
Primary Goals (MVP):
Build a functional CLI tool (mgr-ansible-ssh) capable of executing shell commands on multiple remote hosts using Ansible Runner. Test the tool across a large distributed environment (1000+ machines) to validate its performance and reliability.
Looking forward to significantly reducing the zypper deployment time across all 351 RMT VM servers in our MLM cluster by eliminating the dependency on the taskomatic service, bringing execution down to a fraction of the current duration. The tool should also support multiple runtime flags, such as:
mgr-ansible-ssh: Remote command execution wrapper using Ansible Runner

Usage: mgr-ansible-ssh [--help] [--version] [--inventory INVENTORY]
                   [--run RUN] [--playbook PLAYBOOK] [--limit LIMIT]
                   [--forks FORKS] [--dry-run] [--no-ansible-output]

Required Arguments
--inventory, -i      Path to Ansible inventory file to use

Any One of the Arguments Is Required
--run, -r            Execute the specified shell command on target hosts
--playbook, -p       Execute the specified Ansible playbook on target hosts

Optional Arguments
--help, -h           Show the help message and exit
--version, -v        Show the version and exit
--limit, -l          Limit execution to specific hosts or groups
--forks, -f          Number of parallel Ansible forks
--dry-run            Run in Ansible check mode (requires -p or --playbook)
--no-ansible-output  Suppress Ansible stdout output
Secondary/Stretched Goals (if time permits):
- Add pretty output formatting (success/failure summary per host).
- Implement basic logging of executed commands and results.
- Introduce safety checks for risky commands (shutdown, rm -rf, etc.).
- Package the tool so it can be installed with pip or stored internally.
Resources
Collaboration is welcome from anyone interested in CLI tooling, automation, or distributed systems. Skills that would be particularly valuable include:
- Python especially around CLI dev (argparse, click, rich)
Improve/rework household chore tracker `chorazon` by gniebler
Description
I wrote a household chore tracker named chorazon, which is meant to be deployed as a web application in the household's local network.
It features the ability to set up different (so far only weekly) schedules per task and per person, where tasks may span several days.
There are "tokens", which can be collected by users. Tasks can (and usually will) have rewards configured where they yield a certain amount of tokens. The idea is that they can later be redeemed for (surprise) gifts, but this is not implemented yet. (So right now one needs to edit the DB manually to subtract tokens when they're redeemed.)
Days are not rolled over automatically, to allow for task completion control.
We used it in my household for several months, with mixed success. There are many limitations in the system that would warrant a revisit.
It's written using the Pyramid Python framework with URL traversal, ZODB as the data store and Web Components for the frontend.
Goals
- Add admin screens for users, tasks and schedules
- Add models, pages etc. to allow redeeming tokens for gifts/surprises
- …?
Resources
tbd (Gitlab repo)
Improve chore and screen time doc generator script `wochenplaner` by gniebler
Description
I wrote a little Python script to generate PDF docs, which can be used to track daily chore completion and screen time usage for several people, with one page per person/week.
I named this script wochenplaner and have been using it for a few months now.
It needs some improvements and adjustments in how the screen time should be tracked and how chores are displayed.
Goals
- Fix chore field separation lines
- Change screen time tracking logic from "global" (week-long) to daily subtraction and weekly addition of remainders (more intuitive than current "weekly time budget method)
- Add logic to fill in chore fields/lines, ideally with pictures, falling back to text.
Resources
tbd (Gitlab repo)
openQA log viewer by mpagot
Description
*** Warning: Are You at Risk for VOMIT? ***
Do you find yourself staring at a screen, your eyes glossing over as thousands of lines of text scroll by? Do you feel a wave of text-based nausea when someone asks you to "just check the logs"?
You may be suffering from VOMIT (Verbose Output Mental Irritation Toxicity).
This dangerous, work-induced ailment is triggered by exposure to an overwhelming quantity of log data, especially from parallel systems. The human brain, not designed to mentally process 12 simultaneous autoinst-log.txt files, enters a state of toxic shock. It rejects the "Verbose Output," making it impossible to find the one critical error line buried in a 50,000-line sea of "INFO: doing a thing."
Before you're forced to rm -rf /var/log in a fit of desperation, we present the digital antacid.
No panic: we have The openQA Log Visualizer
This is the UI antidote for handling toxic log environments. It bravely dives into the chaotic, multi-machine mess of your openQA test runs, finds all the related, verbose logs, and force-feeds them into a parser.
Goals
Work on the existing POC openqa-log-visualizer about few specific tasks:
- add support for more type of logs
- extend the configuration file syntax beyond the actual one
- work on log parsing performance
Find some beta-tester and collect feedback and ideas about features
If time allow for it evaluate other UI frameworks and solutions (something more simple to distribute and run, maybe more low level to gain in performance).
Resources
Set Up an Ephemeral Uyuni Instance by mbussolotto
Description
To test, check, and verify the latest changes in the master branch, we want to easily set up an ephemeral environment.
Goals
- Create an ephemeral environment manually
Create an ephemeral environment automatically
Resources
https://github.com/uyuni-project/uyuni
https://www.uyuni-project.org/uyuni-docs/en/uyuni/index.html
Testing and adding GNU/Linux distributions on Uyuni by juliogonzalezgil
Join the Gitter channel! https://gitter.im/uyuni-project/hackweek
Uyuni is a configuration and infrastructure management tool that saves you time and headaches when you have to manage and update tens, hundreds or even thousands of machines. It also manages configuration, can run audits, build image containers, monitor and much more!
Currently there are a few distributions that are completely untested on Uyuni or SUSE Manager (AFAIK) or just not tested since a long time, and could be interesting knowing how hard would be working with them and, if possible, fix whatever is broken.
For newcomers, the easiest distributions are those based on DEB or RPM packages. Distributions with other package formats are doable, but will require adapting the Python and Java code to be able to sync and analyze such packages (and if salt does not support those packages, it will need changes as well). So if you want a distribution with other packages, make sure you are comfortable handling such changes.
No developer experience? No worries! We had non-developers contributors in the past, and we are ready to help as long as you are willing to learn. If you don't want to code at all, you can also help us preparing the documentation after someone else has the initial code ready, or you could also help with testing :-)
The idea is testing Salt (including bootstrapping with bootstrap script) and Salt-ssh clients
To consider that a distribution has basic support, we should cover at least (points 3-6 are to be tested for both salt minions and salt ssh minions):
- Reposync (this will require using spacewalk-common-channels and adding channels to the .ini file)
- Onboarding (salt minion from UI, salt minion from bootstrap scritp, and salt-ssh minion) (this will probably require adding OS to the bootstrap repository creator)
- Package management (install, remove, update...)
- Patching
- Applying any basic salt state (including a formula)
- Salt remote commands
- Bonus point: Java part for product identification, and monitoring enablement
- Bonus point: sumaform enablement (https://github.com/uyuni-project/sumaform)
- Bonus point: Documentation (https://github.com/uyuni-project/uyuni-docs)
- Bonus point: testsuite enablement (https://github.com/uyuni-project/uyuni/tree/master/testsuite)
If something is breaking: we can try to fix it, but the main idea is research how supported it is right now. Beyond that it's up to each project member how much to hack :-)
- If you don't have knowledge about some of the steps: ask the team
- If you still don't know what to do: switch to another distribution and keep testing.
This card is for EVERYONE, not just developers. Seriously! We had people from other teams helping that were not developers, and added support for Debian and new SUSE Linux Enterprise and openSUSE Leap versions :-)
In progress/done for Hack Week 25
Guide
We started writin a Guide: Adding a new client GNU Linux distribution to Uyuni at https://github.com/uyuni-project/uyuni/wiki/Guide:-Adding-a-new-client-GNU-Linux-distribution-to-Uyuni, to make things easier for everyone, specially those not too familiar wht Uyuni or not technical.
openSUSE Leap 16.0
The distribution will all love!
https://en.opensuse.org/openSUSE:Roadmap#DRAFTScheduleforLeap16.0
Curent Status We started last year, it's complete now for Hack Week 25! :-D
[W]Reposync (this will require using spacewalk-common-channels and adding channels to the .ini file) NOTE: Done, client tools for SLMicro6 are using as those for SLE16.0/openSUSE Leap 16.0 are not available yet[W]Onboarding (salt minion from UI, salt minion from bootstrap scritp, and salt-ssh minion) (this will probably require adding OS to the bootstrap repository creator)[W]Package management (install, remove, update...). Works, even reboot requirement detection
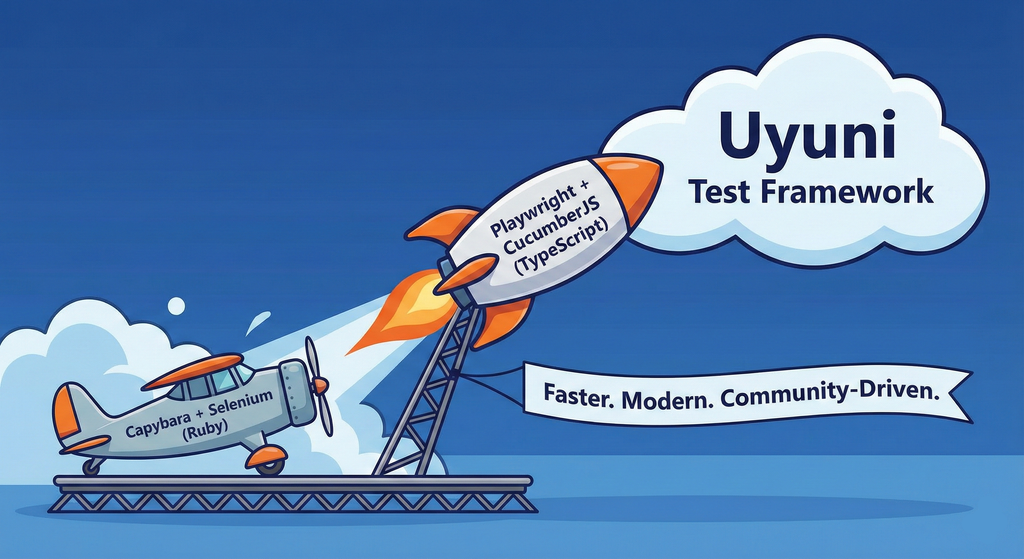
Move Uyuni Test Framework from Selenium to Playwright + AI by oscar-barrios
Description
This project aims to migrate the existing Uyuni Test Framework from Selenium to Playwright. The move will improve the stability, speed, and maintainability of our end-to-end tests by leveraging Playwright's modern features. We'll be rewriting the current Selenium code in Ruby to Playwright code in TypeScript, which includes updating the test framework runner, step definitions, and configurations. This is also necessary because we're moving from Cucumber Ruby to CucumberJS.
If you're still curious about the AI in the title, it was just a way to grab your attention. Thanks for your understanding.
Nah, let's be honest ![]() AI helped a lot to vibe code a good part of the Ruby methods of the Test framework, moving them to Typescript, along with the migration from Capybara to Playwright. I've been using "Cline" as plugin for WebStorm IDE, using Gemini API behind it.
AI helped a lot to vibe code a good part of the Ruby methods of the Test framework, moving them to Typescript, along with the migration from Capybara to Playwright. I've been using "Cline" as plugin for WebStorm IDE, using Gemini API behind it.
Goals
- Migrate Core tests including Onboarding of clients
- Improve test reliabillity: Measure and confirm a significant reduction of flakiness.
- Implement a robust framework: Establish a well-structured and reusable Playwright test framework using the CucumberJS
Resources
- Existing Uyuni Test Framework (Cucumber Ruby + Capybara + Selenium)
- My Template for CucumberJS + Playwright in TypeScript
- Started Hackweek Project
Ansible to Salt integration by vizhestkov
Description
We already have initial integration of Ansible in Salt with the possibility to run playbooks from the salt-master on the salt-minion used as an Ansible Control node.
In this project I want to check if it possible to make Ansible working on the transport of Salt. Basically run playbooks with Ansible through existing established Salt (ZeroMQ) transport and not using ssh at all.
It could be a good solution for the end users to reuse Ansible playbooks or run Ansible modules they got used to with no effort of complex configuration with existing Salt (or Uyuni/SUSE Multi Linux Manager) infrastructure.
Goals
- [v] Prepare the testing environment with Salt and Ansible installed
- [v] Discover Ansible codebase to figure out possible ways of integration
- [v] Create Salt/Uyuni inventory module
- [v] Make basic modules to work with no using separate ssh connection, but reusing existing Salt connection
- [v] Test some most basic playbooks
Resources
Uyuni Saltboot rework by oholecek
Description
When Uyuni switched over to the containerized proxies we had to abandon salt based saltboot infrastructure we had before. Uyuni already had integration with a Cobbler provisioning server and saltboot infra was re-implemented on top of this Cobbler integration.
What was not obvious from the start was that Cobbler, having all it's features, woefully slow when dealing with saltboot size environments. We did some improvements in performance, introduced transactions, and generally tried to make this setup usable. However the underlying slowness remained.
Goals
This project is not something trying to invent new things, it is just finally implementing saltboot infrastructure directly with the Uyuni server core.
Instead of generating grub and pxelinux configurations by Cobbler for all thousands of systems and branches, we will provide a GET access point to retrieve grub or pxelinux file during the boot:
/saltboot/group/grub/$fqdn and similar for systems /saltboot/system/grub/$mac
Next we adapt our tftpd translator to query these points when asked for default or mac based config.
Lastly similar thing needs to be done on our apache server when HTTP UEFI boot is used.
Resources
Enhance setup wizard for Uyuni by PSuarezHernandez
Description
This project wants to enhance the intial setup on Uyuni after its installation, so it's easier for a user to start using with it.
Uyuni currently uses "uyuni-tools" (mgradm) as the installation entrypoint, to trigger the installation of Uyuni in the given host, but does not really perform an initial setup, for instance:
- user creation
- adding products / channels
- generating bootstrap repos
- create activation keys
- ...
Goals
- Provide initial setup wizard as part of mgradm uyuni installation
Resources
Testing and adding GNU/Linux distributions on Uyuni by juliogonzalezgil
Join the Gitter channel! https://gitter.im/uyuni-project/hackweek
Uyuni is a configuration and infrastructure management tool that saves you time and headaches when you have to manage and update tens, hundreds or even thousands of machines. It also manages configuration, can run audits, build image containers, monitor and much more!
Currently there are a few distributions that are completely untested on Uyuni or SUSE Manager (AFAIK) or just not tested since a long time, and could be interesting knowing how hard would be working with them and, if possible, fix whatever is broken.
For newcomers, the easiest distributions are those based on DEB or RPM packages. Distributions with other package formats are doable, but will require adapting the Python and Java code to be able to sync and analyze such packages (and if salt does not support those packages, it will need changes as well). So if you want a distribution with other packages, make sure you are comfortable handling such changes.
No developer experience? No worries! We had non-developers contributors in the past, and we are ready to help as long as you are willing to learn. If you don't want to code at all, you can also help us preparing the documentation after someone else has the initial code ready, or you could also help with testing :-)
The idea is testing Salt (including bootstrapping with bootstrap script) and Salt-ssh clients
To consider that a distribution has basic support, we should cover at least (points 3-6 are to be tested for both salt minions and salt ssh minions):
- Reposync (this will require using spacewalk-common-channels and adding channels to the .ini file)
- Onboarding (salt minion from UI, salt minion from bootstrap scritp, and salt-ssh minion) (this will probably require adding OS to the bootstrap repository creator)
- Package management (install, remove, update...)
- Patching
- Applying any basic salt state (including a formula)
- Salt remote commands
- Bonus point: Java part for product identification, and monitoring enablement
- Bonus point: sumaform enablement (https://github.com/uyuni-project/sumaform)
- Bonus point: Documentation (https://github.com/uyuni-project/uyuni-docs)
- Bonus point: testsuite enablement (https://github.com/uyuni-project/uyuni/tree/master/testsuite)
If something is breaking: we can try to fix it, but the main idea is research how supported it is right now. Beyond that it's up to each project member how much to hack :-)
- If you don't have knowledge about some of the steps: ask the team
- If you still don't know what to do: switch to another distribution and keep testing.
This card is for EVERYONE, not just developers. Seriously! We had people from other teams helping that were not developers, and added support for Debian and new SUSE Linux Enterprise and openSUSE Leap versions :-)
In progress/done for Hack Week 25
Guide
We started writin a Guide: Adding a new client GNU Linux distribution to Uyuni at https://github.com/uyuni-project/uyuni/wiki/Guide:-Adding-a-new-client-GNU-Linux-distribution-to-Uyuni, to make things easier for everyone, specially those not too familiar wht Uyuni or not technical.
openSUSE Leap 16.0
The distribution will all love!
https://en.opensuse.org/openSUSE:Roadmap#DRAFTScheduleforLeap16.0
Curent Status We started last year, it's complete now for Hack Week 25! :-D
[W]Reposync (this will require using spacewalk-common-channels and adding channels to the .ini file) NOTE: Done, client tools for SLMicro6 are using as those for SLE16.0/openSUSE Leap 16.0 are not available yet[W]Onboarding (salt minion from UI, salt minion from bootstrap scritp, and salt-ssh minion) (this will probably require adding OS to the bootstrap repository creator)[W]Package management (install, remove, update...). Works, even reboot requirement detection
Set Uyuni to manage edge clusters at scale by RDiasMateus
Description
Prepare a Poc on how to use MLM to manage edge clusters. Those cluster are normally equal across each location, and we have a large number of them.
The goal is to produce a set of sets/best practices/scripts to help users manage this kind of setup.
Goals
step 1: Manual set-up
Goal: Have a running application in k3s and be able to update it using System Update Controler (SUC)
- Deploy Micro 6.2 machine
Deploy k3s - single node
- https://docs.k3s.io/quick-start
Build/find a simple web application (static page)
- Build/find a helmchart to deploy the application
Deploy the application on the k3s cluster
Install App updates through helm update
Install OS updates using MLM
step 2: Automate day 1
Goal: Trigger the application deployment and update from MLM
- Salt states For application (with static data)
- Deploy the application helmchart, if not present
- install app updates through helmchart parameters
- Link it to GIT
- Define how to link the state to the machines (based in some pillar data? Using configuration channels by importing the state? Naming convention?)
- Use git update to trigger helmchart app update
- Recurrent state applying configuration channel?
step 3: Multi-node cluster
Goal: Use SUC to update a multi-node cluster.
- Create a multi-node cluster
- Deploy application
- call the helm update/install only on control plane?
- Install App updates through helm update
- Prepare a SUC for OS update (k3s also? How?)
- https://github.com/rancher/system-upgrade-controller
- https://documentation.suse.com/cloudnative/k3s/latest/en/upgrades/automated.html
- Update/deploy the SUC?
- Update/deploy the SUC CRD with the update procedure