Last hackweek filtra was created – a tool to extract information like lead and cycle times from Github repos for (but not limited to) projects that are doing Kanban. The collected metrics can then be visualized with Grafana.
Currently there are two problems with filtra:
- There are two branches. The master branch, that can query information from one project per instance and the multi-board branch, that can query from multiple projects. Sadly the metrics looks a bit different for both of the branches and this needs to be fixed. Also unittests are badly needed! See: Metrics are different #20 and Missing Tests #23
- Currently filtra is basically a Prometheus endpoint. But Prometheus is not a perfect fit for this use-case, since we are only collecting a few metrics per day but with a very high retention. This is usually different for data collected with Prometheus. So the conclusion was that Postgresql would be a better fit for storing that data.


Looking for hackers with the skills:
go golang github metrics graphql grafana postgresql leadtime cycletime projectmanagement
This project is part of:
Hack Week 19
Activity
Comments
-

almost 6 years ago by jochenbreuer | Reply
First update: We'll go with Sqlite instead of Postgresql.
Similar Projects
Play with the userfaultfd(2) system call and download on demand using HTTP Range Requests with Golang by rbranco
Description
The userfaultfd(2) is a cool system call to handle page faults in user-space. This should allow me to list the contents of an ISO or similar archive without downloading the whole thing. The userfaultfd(2) part can also be done in theory with the PROT_NONE mprotect + SIGSEGV trick, for complete Unix portability, though reportedly being slower.
Goals
- Create my own library for userfaultfd(2) in Golang.
- Create my own library for HTTP Range Requests.
- Complete portability with Unix.
- Benchmarks.
- Contribute some tests to LTP.
Resources
- https://docs.kernel.org/admin-guide/mm/userfaultfd.html
- https://www.cons.org/cracauer/cracauer-userfaultfd.html
Create a go module to wrap happy-compta.fr by cbosdonnat
Description
https://happy-compta.fr is a tool for french work councils simple book keeping. While it does the job, it has no API to work with and it is tedious to enter loads of operations.
Goals
Write a go client module to be used as an API to programmatically manipulate the tool.
Writing an example tool to load data from a CSV file would be good too.
Help Create A Chat Control Resistant Turnkey Chatmail/Deltachat Relay Stack - Rootless Podman Compose, OpenSUSE BCI, Hardened, & SELinux by 3nd5h1771fy
Description
The Mission: Decentralized & Sovereign Messaging
FYI: If you have never heard of "Chatmail", you can visit their site here, but simply put it can be thought of as the underlying protocol/platform decentralized messengers like DeltaChat use for their communications. Do not confuse it with the honeypot looking non-opensource paid for prodect with better seo that directs you to chatmailsecure(dot)com
In an era of increasing centralized surveillance by unaccountable bad actors (aka BigTech), "Chat Control," and the erosion of digital privacy, the need for sovereign communication infrastructure is critical. Chatmail is a pioneering initiative that bridges the gap between classic email and modern instant messaging, offering metadata-minimized, end-to-end encrypted (E2EE) communication that is interoperable and open.
However, unless you are a seasoned sysadmin, the current recommended deployment method of a Chatmail relay is rigid, fragile, difficult to properly secure, and effectively takes over the entire host the "relay" is deployed on.
Why This Matters
A simple, host agnostic, reproducible deployment lowers the entry cost for anyone wanting to run a privacy‑preserving, decentralized messaging relay. In an era of perpetually resurrected chat‑control legislation threats, EU digital‑sovereignty drives, and many dangers of using big‑tech messaging platforms (Apple iMessage, WhatsApp, FB Messenger, Instagram, SMS, Google Messages, etc...) for any type of communication, providing an easy‑to‑use alternative empowers:
- Censorship resistance - No single entity controls the relay; operators can spin up new nodes quickly.
- Surveillance mitigation - End‑to‑end OpenPGP encryption ensures relay operators never see plaintext.
- Digital sovereignty - Communities can host their own infrastructure under local jurisdiction, aligning with national data‑policy goals.
By turning the Chatmail relay into a plug‑and‑play container stack, we enable broader adoption, foster a resilient messaging fabric, and give developers, activists, and hobbyists a concrete tool to defend privacy online.
Goals
As I indicated earlier, this project aims to drastically simplify the deployment of Chatmail relay. By converting this architecture into a portable, containerized stack using Podman and OpenSUSE base container images, we can allow anyone to deploy their own censorship-resistant, privacy-preserving communications node in minutes.
Our goal for Hack Week: package every component into containers built on openSUSE/MicroOS base images, initially orchestrated with a single container-compose.yml (podman-compose compatible). The stack will:
- Run on any host that supports Podman (including optimizations and enhancements for SELinux‑enabled systems).
- Allow network decoupling by refactoring configurations to move from file-system constrained Unix sockets to internal TCP networking, allowing containers achieve stricter isolation.
- Utilize Enhanced Security with SELinux by using purpose built utilities such as udica we can quickly generate custom SELinux policies for the container stack, ensuring strict confinement superior to standard/typical Docker deployments.
- Allow the use of bind or remote mounted volumes for shared data (
/var/vmail, DKIM keys, TLS certs, etc.). - Replace the local DNS server requirement with a remote DNS‑provider API for DKIM/TXT record publishing.
By delivering a turnkey, host agnostic, reproducible deployment, we lower the barrier for individuals and small communities to launch their own chatmail relays, fostering a decentralized, censorship‑resistant messaging ecosystem that can serve DeltaChat users and/or future services adopting this protocol
Resources
- The links included above
- https://chatmail.at/doc/relay/
- https://delta.chat/en/help
- Project repo -> https://codeberg.org/EndShittification/containerized-chatmail-relay
Cluster API Provider for Harvester by rcase
Project Description
The Cluster API "infrastructure provider" for Harvester, also named CAPHV, makes it possible to use Harvester with Cluster API. This enables people and organisations to create Kubernetes clusters running on VMs created by Harvester using a declarative spec.
The project has been bootstrapped in HackWeek 23, and its code is available here.
Work done in HackWeek 2023
- Have a early working version of the provider available on Rancher Sandbox : *DONE *
- Demonstrated the created cluster can be imported using Rancher Turtles: DONE
- Stretch goal - demonstrate using the new provider with CAPRKE2: DONE and the templates are available on the repo
DONE in HackWeek 24:
- Add more Unit Tests
- Improve Status Conditions for some phases
- Add cloud provider config generation
- Testing with Harvester v1.3.2
- Template improvements
- Issues creation
DONE in 2025 (out of Hackweek)
- Support of ClusterClass
- Add to
clusterctlcommunity providers, you can add it directly withclusterctl - Testing on newer versions of Harvester v1.4.X and v1.5.X
- Support for
clusterctl generate cluster ... - Improve Status Conditions to reflect current state of Infrastructure
- Improve CI (some bugs for release creation)
Goals for HackWeek 2025
- FIRST and FOREMOST, any topic is important to you
- Add e2e testing
- Certify the provider for Rancher Turtles
- Add Machine pool labeling
- Add PCI-e passthrough capabilities.
- Other improvement suggestions are welcome!
Thanks to @isim and Dominic Giebert for their contributions!
Resources
Looking for help from anyone interested in Cluster API (CAPI) or who wants to learn more about Harvester.
This will be an infrastructure provider for Cluster API. Some background reading for the CAPI aspect:
A CLI for Harvester by mohamed.belgaied
Harvester does not officially come with a CLI tool, the user is supposed to interact with Harvester mostly through the UI. Though it is theoretically possible to use kubectl to interact with Harvester, the manipulation of Kubevirt YAML objects is absolutely not user friendly. Inspired by tools like multipass from Canonical to easily and rapidly create one of multiple VMs, I began the development of Harvester CLI. Currently, it works but Harvester CLI needs some love to be up-to-date with Harvester v1.0.2 and needs some bug fixes and improvements as well.
Project Description
Harvester CLI is a command line interface tool written in Go, designed to simplify interfacing with a Harvester cluster as a user. It is especially useful for testing purposes as you can easily and rapidly create VMs in Harvester by providing a simple command such as:
harvester vm create my-vm --count 5
to create 5 VMs named my-vm-01 to my-vm-05.

Harvester CLI is functional but needs a number of improvements: up-to-date functionality with Harvester v1.0.2 (some minor issues right now), modifying the default behaviour to create an opensuse VM instead of an ubuntu VM, solve some bugs, etc.
Github Repo for Harvester CLI: https://github.com/belgaied2/harvester-cli
Done in previous Hackweeks
- Create a Github actions pipeline to automatically integrate Harvester CLI to Homebrew repositories: DONE
- Automatically package Harvester CLI for OpenSUSE / Redhat RPMs or DEBs: DONE
Goal for this Hackweek
The goal for this Hackweek is to bring Harvester CLI up-to-speed with latest Harvester versions (v1.3.X and v1.4.X), and improve the code quality as well as implement some simple features and bug fixes.
Some nice additions might be: * Improve handling of namespaced objects * Add features, such as network management or Load Balancer creation ? * Add more unit tests and, why not, e2e tests * Improve CI * Improve the overall code quality * Test the program and create issues for it
Issue list is here: https://github.com/belgaied2/harvester-cli/issues
Resources
The project is written in Go, and using client-go the Kubernetes Go Client libraries to communicate with the Harvester API (which is Kubernetes in fact).
Welcome contributions are:
- Testing it and creating issues
- Documentation
- Go code improvement
What you might learn
Harvester CLI might be interesting to you if you want to learn more about:
- GitHub Actions
- Harvester as a SUSE Product
- Go programming language
- Kubernetes API
- Kubevirt API objects (Manipulating VMs and VM Configuration in Kubernetes using Kubevirt)
Play with the userfaultfd(2) system call and download on demand using HTTP Range Requests with Golang by rbranco
Description
The userfaultfd(2) is a cool system call to handle page faults in user-space. This should allow me to list the contents of an ISO or similar archive without downloading the whole thing. The userfaultfd(2) part can also be done in theory with the PROT_NONE mprotect + SIGSEGV trick, for complete Unix portability, though reportedly being slower.
Goals
- Create my own library for userfaultfd(2) in Golang.
- Create my own library for HTTP Range Requests.
- Complete portability with Unix.
- Benchmarks.
- Contribute some tests to LTP.
Resources
- https://docs.kernel.org/admin-guide/mm/userfaultfd.html
- https://www.cons.org/cracauer/cracauer-userfaultfd.html
Updatecli Autodiscovery supporting WASM plugins by olblak
Description
Updatecli is a Golang Update policy engine that allow to write Update policies in YAML manifest. Updatecli already has a plugin ecosystem for common update strategies such as automating Dockerfile or Kubernetes manifest from Git repositories.
This is what we call autodiscovery where Updatecli generate manifest and apply them dynamically based on some context.
Obviously, the Updatecli project doesn't accept plugins specific to an organization.
I saw project using different languages such as python, C#, or JS to generate those manifest.
It would be great to be able to share and reuse those specific plugins
During the HackWeek, I'll hang on the Updatecli matrix channel
https://matrix.to/#/#Updatecli_community:gitter.im
Goals
Implement autodiscovery plugins using WASM. I am planning to experiment with https://github.com/extism/extism
To build a simple WASM autodiscovery plugin and run it from Updatecli
Resources
- https://github.com/extism/extism
- https://github.com/updatecli/updatecli
- https://www.updatecli.io/docs/core/autodiscovery/
- https://matrix.to/#/#Updatecli_community:gitter.im
Q2Boot - A handy QEMU VM launcher by amanzini
Description
Q2Boot (Qemu Quick Boot) is a command-line tool that wraps QEMU to provide a streamlined experience for launching virtual machines. It automatically configures common settings like KVM acceleration, virtio drivers, and networking while allowing customization through both configuration files and command-line options.
The project originally was a personal utility in D, now recently rewritten in idiomatic Go. It lives at repository https://github.com/ilmanzo/q2boot
Goals
Improve the project, testing with different scenarios , address issues and propose new features. It will benefit of some basic integration testing by providing small sample disk images.
Updates
- Dec 1, 2025 : refactor command line options, added structured logging. Released v0.0.2
- Dec 2, 2025 : added external monitor via telnet option
- Dec 4, 2025 : released v0.0.3 with architecture auto-detection
- Dec 5, 2025 : filing new issues and general polishment. Designing E2E testing
Resources
Rewrite Distrobox in go (POC) by fabriziosestito
Description
Rewriting Distrobox in Go.
Main benefits:
- Easier to maintain and to test
- Adapter pattern for different container backends (LXC, systemd-nspawn, etc.)
Goals
- Build a minimal starting point with core commands
- Keep the CLI interface compatible: existing users shouldn't notice any difference
- Use a clean Go architecture with adapters for different container backends
- Keep dependencies minimal and binary size small
- Benchmark against the original shell script
Resources
- Upstream project: https://github.com/89luca89/distrobox/
- Distrobox site: https://distrobox.it/
- ArchWiki: https://wiki.archlinux.org/title/Distrobox
terraform-provider-feilong by e_bischoff
Project Description
People need to test operating systems and applications on s390 platform. While this is straightforward with KVM, this is very difficult with z/VM.
IBM Cloud Infrastructure Center (ICIC) harnesses the Feilong API, but you can use Feilong without installing ICIC(see this schema).
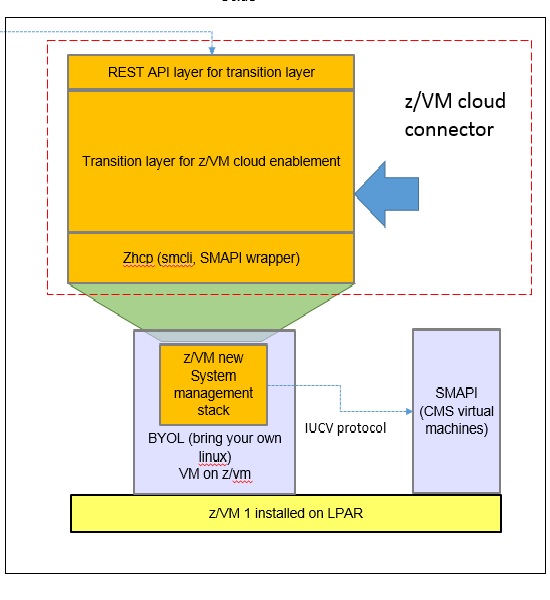
What about writing a terraform Feilong provider, just like we have the terraform libvirt provider? That would allow to transparently call Feilong from your main.tf files to deploy and destroy resources on your z/VM system.
Goal for Hackweek 23
I would like to be able to easily deploy and provision VMs automatically on a z/VM system, in a way that people might enjoy even outside of SUSE.
My technical preference is to write a terraform provider plugin, as it is the approach that involves the least software components for our deployments, while remaining clean, and compatible with our existing development infrastructure.
Goals for Hackweek 24
Feilong provider works and is used internally by SUSE Manager team. Let's push it forward!
Let's add support for fiberchannel disks and multipath.
Goals for Hackweek 25
Modernization, maturity, and maintenance: support for SLES 16 and openTofu, new API calls, fixes...
Resources
Outcome
issuefs: FUSE filesystem representing issues (e.g. JIRA) for the use with AI agents code-assistants by llansky3
Description
Creating a FUSE filesystem (issuefs) that mounts issues from various ticketing systems (Github, Jira, Bugzilla, Redmine) as files to your local file system.
And why this is good idea?
- User can use favorite command line tools to view and search the tickets from various sources
- User can use AI agents capabilities from your favorite IDE or cli to ask question about the issues, project or functionality while providing relevant tickets as context without extra work.
- User can use it during development of the new features when you let the AI agent to jump start the solution. The issuefs will give the AI agent the context (AI agents just read few more files) about the bug or requested features. No need for copying and pasting issues to user prompt or by using extra MCP tools to access the issues. These you can still do but this approach is on purpose different.

Goals
- Add Github issue support
- Proof the concept/approach by apply the approach on itself using Github issues for tracking and development of new features
- Add support for Bugzilla and Redmine using this approach in the process of doing it. Record a video of it.
- Clean-up and test the implementation and create some documentation
- Create a blog post about this approach
Resources
There is a prototype implementation here. This currently sort of works with JIRA only.
Is SUSE Trending? Popularity and Developer Sentiment Insight Using Native AI Capabilities by terezacerna
Description
This project aims to explore the popularity and developer sentiment around SUSE and its technologies compared to Red Hat and their technologies. Using publicly available data sources, I will analyze search trends, developer preferences, repository activity, and media presence. The final outcome will be an interactive Power BI dashboard that provides insights into how SUSE is perceived and discussed across the web and among developers.
Goals
- Assess the popularity of SUSE products and brand compared to Red Hat using Google Trends.
- Analyze developer satisfaction and usage trends from the Stack Overflow Developer Survey.
- Use the GitHub API to compare SUSE and Red Hat repositories in terms of stars, forks, contributors, and issue activity.
- Perform sentiment analysis on GitHub issue comments to measure community tone and engagement using built-in Copilot capabilities.
- Perform sentiment analysis on Reddit comments related to SUSE technologies using built-in Copilot capabilities.
- Use Gnews.io to track and compare the volume of news articles mentioning SUSE and Red Hat technologies.
- Test the integration of Copilot (AI) within Power BI for enhanced data analysis and visualization.
- Deliver a comprehensive Power BI report summarizing findings and insights.
- Test the full potential of Power BI, including its AI features and native language Q&A.
Resources
- Google Trends: Web scraping for search popularity data
- Stack Overflow Developer Survey: For technology popularity and satisfaction comparison
- GitHub API: For repository data (stars, forks, contributors, issues, comments).
- Gnews.io API: For article volume and mentions analysis.
- Reddit: SUSE related topics with comments.
The Agentic Rancher Experiment: Do Androids Dream of Electric Cattle? by moio
Rancher is a beast of a codebase. Let's investigate if the new 2025 generation of GitHub Autonomous Coding Agents and Copilot Workspaces can actually tame it. 
The Plan
Create a sandbox GitHub Organization, clone in key Rancher repositories, and let the AI loose to see if it can handle real-world enterprise OSS maintenance - or if it just hallucinates new breeds of Kubernetes resources!
Specifically, throw "Agentic Coders" some typical tasks in a complex, long-lived open-source project, such as:
❥ The Grunt Work: generate missing GoDocs, unit tests, and refactorings. Rebase PRs.
❥ The Complex Stuff: fix actual (historical) bugs and feature requests to see if they can traverse the complexity without (too much) human hand-holding.
❥ Hunting Down Gaps: find areas lacking in docs, areas of improvement in code, dependency bumps, and so on.
If time allows, also experiment with Model Context Protocol (MCP) to give agents context on our specific build pipelines and CI/CD logs.
Why?
We know AI can write "Hello World." and also moderately complex programs from a green field. But can it rebase a 3-month-old PR with conflicts in rancher/rancher? I want to find the breaking point of current AI agents to determine if and how they can help us to reduce our technical debt, work faster and better. At the same time, find out about pitfalls and shortcomings.
The CONCLUSION!!!
A ![]() State of the Union
State of the Union ![]() document was compiled to summarize lessons learned this week. For more gory details, just read on the diary below!
document was compiled to summarize lessons learned this week. For more gory details, just read on the diary below! ![]()
Flaky Tests AI Finder for Uyuni and MLM Test Suites by oscar-barrios
Description
Our current Grafana dashboards provide a great overview of test suite health, including a panel for "Top failed tests." However, identifying which of these failures are due to legitimate bugs versus intermittent "flaky tests" is a manual, time-consuming process. These flaky tests erode trust in our test suites and slow down development.
This project aims to build a simple but powerful Python script that automates flaky test detection. The script will directly query our Prometheus instance for the historical data of each failed test, using the jenkins_build_test_case_failure_age metric. It will then format this data and send it to the Gemini API with a carefully crafted prompt, asking it to identify which tests show a flaky pattern.
The final output will be a clean JSON list of the most probable flaky tests, which can then be used to populate a new "Top Flaky Tests" panel in our existing Grafana test suite dashboard.
Goals
By the end of Hack Week, we aim to have a single, working Python script that:
- Connects to Prometheus and executes a query to fetch detailed test failure history.
- Processes the raw data into a format suitable for the Gemini API.
- Successfully calls the Gemini API with the data and a clear prompt.
- Parses the AI's response to extract a simple list of flaky tests.
- Saves the list to a JSON file that can be displayed in Grafana.
- New panel in our Dashboard listing the Flaky tests
Resources
- Jenkins Prometheus Exporter: https://github.com/uyuni-project/jenkins-exporter/
- Data Source: Our internal Prometheus server.
- Key Metric:
jenkins_build_test_case_failure_age{jobname, buildid, suite, case, status, failedsince}. - Existing Query for Reference:
count by (suite) (max_over_time(jenkins_build_test_case_failure_age{status=~"FAILED|REGRESSION", jobname="$jobname"}[$__range])). - AI Model: The Google Gemini API.
- Example about how to interact with Gemini API: https://github.com/srbarrios/FailTale/
- Visualization: Our internal Grafana Dashboard.
- Internal IaC: https://gitlab.suse.de/galaxy/infrastructure/-/tree/master/srv/salt/monitoring
Outcome
- Jenkins Flaky Test Detector: https://github.com/srbarrios/jenkins-flaky-tests-detector and its container
- IaC on MLM Team: https://gitlab.suse.de/galaxy/infrastructure/-/tree/master/srv/salt/monitoring/jenkinsflakytestsdetector?reftype=heads, https://gitlab.suse.de/galaxy/infrastructure/-/blob/master/srv/salt/monitoring/grafana/dashboards/flaky-tests.json?ref_type=heads, and others.
- Grafana Dashboard: https://grafana.mgr.suse.de/d/flaky-tests/flaky-tests-detection @ @ text
Uyuni Health-check Grafana AI Troubleshooter by ygutierrez
Description
This project explores the feasibility of using the open-source Grafana LLM plugin to enhance the Uyuni Health-check tool with LLM capabilities. The idea is to integrate a chat-based "AI Troubleshooter" directly into existing dashboards, allowing users to ask natural-language questions about errors, anomalies, or performance issues.
Goals
- Investigate if and how the
grafana-llm-appplug-in can be used within the Uyuni Health-check tool. - Investigate if this plug-in can be used to query LLMs for troubleshooting scenarios.
- Evaluate support for local LLMs and external APIs through the plugin.
- Evaluate if and how the Uyuni MCP server could be integrated as another source of information.
Resources
Uyuni read-only replica by cbosdonnat
Description
For now, there is no possible HA setup for Uyuni. The idea is to explore setting up a read-only shadow instance of an Uyuni and make it as useful as possible.
Possible things to look at:
- live sync of the database, probably using the WAL. Some of the tables may have to be skipped or some features disabled on the RO instance (taskomatic, PXT sessions…)
- Can we use a load balancer that routes read-only queries to either instance and the other to the RW one? For example, packages or PXE data can be served by both, the API GET requests too. The rest would be RW.
Goals
- Prepare a document explaining how to do it.
- PR with the needed code changes to support it