Project Description
I have casually investigated that recent open source image generation AI systems are relatively invasive of the host system if one starts to install them that way. Usually container is better but needs special configuration to access the needed hardware. I'd like to run something in a container utilizing the RDNA2 Radeon gfx card I have on my desktop computer.
The exact container type would be evaluated, and of course existing solutions will be seeked.
Goal for this Hackweek
The goals for the Hackweek include to have suitable optimized container that can be created from scratch with one command and can generate SUSE related images with the AMD graphics with 8GB RAM (which is a bit limited apparently).
Resources
https://github.com/tjyrinki/sd-rocm
Results
See the github link above, images below and the blog post at https://timojyrinki.gitlab.io/hugo/post/2023-02-02-stablediffusion-docker/

This project is part of:
Hack Week 22
Activity
Comments
-

about 3 years ago by tjyrinki_suse | Reply
Blog post at https://timojyrinki.gitlab.io/hugo/post/2023-02-02-stablediffusion-docker/ – read more there!
See the git repo for what has been done as part of this project.

-
Reply to tjyrinki_suse
Blog post at https://timojyrinki.gitlab.io/hugo/post/2023-02-02-stablediffusion-docker/ – read more there!
See the git repo for what has been done as part of this project.
# A First Level Header ## A Second Level Header Use one asterisk to *emphasize* Use two asterisks for **strong emphasis** - Use hyphens - for unordereed - lists This is an [link to example.com](http://example.com/) This is an image  This is a user link @hans This is a project link hw#some-cool-title
Reply to tjyrinki_suse

# A First Level Header ## A Second Level Header Use one asterisk to *emphasize* Use two asterisks for **strong emphasis** - Use hyphens - for unordereed - lists This is an [link to example.com](http://example.com/) This is an image  This is a user link @hans This is a project link hw#some-cool-title
Similar Projects
Technical talks at universities by agamez
Description
This project aims to empower the next generation of tech professionals by offering hands-on workshops on containerization and Kubernetes, with a strong focus on open-source technologies. By providing practical experience with these cutting-edge tools and fostering a deep understanding of open-source principles, we aim to bridge the gap between academia and industry.
For now, the scope is limited to Spanish universities, since we already have the contacts and have started some conversations.
Goals
- Technical Skill Development: equip students with the fundamental knowledge and skills to build, deploy, and manage containerized applications using open-source tools like Kubernetes.
- Open-Source Mindset: foster a passion for open-source software, encouraging students to contribute to open-source projects and collaborate with the global developer community.
- Career Readiness: prepare students for industry-relevant roles by exposing them to real-world use cases, best practices, and open-source in companies.
Resources
- Instructors: experienced open-source professionals with deep knowledge of containerization and Kubernetes.
- SUSE Expertise: leverage SUSE's expertise in open-source technologies to provide insights into industry trends and best practices.
Port the classic browser game HackTheNet to PHP 8 by dgedon
Description
The classic browser game HackTheNet from 2004 still runs on PHP 4/5 and MySQL 5 and needs a port to PHP 8 and e.g. MariaDB.
Goals
- Port the game to PHP 8 and MariaDB 11
- Create a container where the game server can simply be started/stopped
Resources
- https://github.com/nodeg/hackthenet
Rewrite Distrobox in go (POC) by fabriziosestito
Description
Rewriting Distrobox in Go.
Main benefits:
- Easier to maintain and to test
- Adapter pattern for different container backends (LXC, systemd-nspawn, etc.)
Goals
- Build a minimal starting point with core commands
- Keep the CLI interface compatible: existing users shouldn't notice any difference
- Use a clean Go architecture with adapters for different container backends
- Keep dependencies minimal and binary size small
- Benchmark against the original shell script
Resources
- Upstream project: https://github.com/89luca89/distrobox/
- Distrobox site: https://distrobox.it/
- ArchWiki: https://wiki.archlinux.org/title/Distrobox
Help Create A Chat Control Resistant Turnkey Chatmail/Deltachat Relay Stack - Rootless Podman Compose, OpenSUSE BCI, Hardened, & SELinux by 3nd5h1771fy
Description
The Mission: Decentralized & Sovereign Messaging
FYI: If you have never heard of "Chatmail", you can visit their site here, but simply put it can be thought of as the underlying protocol/platform decentralized messengers like DeltaChat use for their communications. Do not confuse it with the honeypot looking non-opensource paid for prodect with better seo that directs you to chatmailsecure(dot)com
In an era of increasing centralized surveillance by unaccountable bad actors (aka BigTech), "Chat Control," and the erosion of digital privacy, the need for sovereign communication infrastructure is critical. Chatmail is a pioneering initiative that bridges the gap between classic email and modern instant messaging, offering metadata-minimized, end-to-end encrypted (E2EE) communication that is interoperable and open.
However, unless you are a seasoned sysadmin, the current recommended deployment method of a Chatmail relay is rigid, fragile, difficult to properly secure, and effectively takes over the entire host the "relay" is deployed on.
Why This Matters
A simple, host agnostic, reproducible deployment lowers the entry cost for anyone wanting to run a privacy‑preserving, decentralized messaging relay. In an era of perpetually resurrected chat‑control legislation threats, EU digital‑sovereignty drives, and many dangers of using big‑tech messaging platforms (Apple iMessage, WhatsApp, FB Messenger, Instagram, SMS, Google Messages, etc...) for any type of communication, providing an easy‑to‑use alternative empowers:
- Censorship resistance - No single entity controls the relay; operators can spin up new nodes quickly.
- Surveillance mitigation - End‑to‑end OpenPGP encryption ensures relay operators never see plaintext.
- Digital sovereignty - Communities can host their own infrastructure under local jurisdiction, aligning with national data‑policy goals.
By turning the Chatmail relay into a plug‑and‑play container stack, we enable broader adoption, foster a resilient messaging fabric, and give developers, activists, and hobbyists a concrete tool to defend privacy online.
Goals
As I indicated earlier, this project aims to drastically simplify the deployment of Chatmail relay. By converting this architecture into a portable, containerized stack using Podman and OpenSUSE base container images, we can allow anyone to deploy their own censorship-resistant, privacy-preserving communications node in minutes.
Our goal for Hack Week: package every component into containers built on openSUSE/MicroOS base images, initially orchestrated with a single container-compose.yml (podman-compose compatible). The stack will:
- Run on any host that supports Podman (including optimizations and enhancements for SELinux‑enabled systems).
- Allow network decoupling by refactoring configurations to move from file-system constrained Unix sockets to internal TCP networking, allowing containers achieve stricter isolation.
- Utilize Enhanced Security with SELinux by using purpose built utilities such as udica we can quickly generate custom SELinux policies for the container stack, ensuring strict confinement superior to standard/typical Docker deployments.
- Allow the use of bind or remote mounted volumes for shared data (
/var/vmail, DKIM keys, TLS certs, etc.). - Replace the local DNS server requirement with a remote DNS‑provider API for DKIM/TXT record publishing.
By delivering a turnkey, host agnostic, reproducible deployment, we lower the barrier for individuals and small communities to launch their own chatmail relays, fostering a decentralized, censorship‑resistant messaging ecosystem that can serve DeltaChat users and/or future services adopting this protocol
Resources
- The links included above
- https://chatmail.at/doc/relay/
- https://delta.chat/en/help
- Project repo -> https://codeberg.org/EndShittification/containerized-chatmail-relay
AI-Powered Unit Test Automation for Agama by joseivanlopez
The Agama project is a multi-language Linux installer that leverages the distinct strengths of several key technologies:
- Rust: Used for the back-end services and the core HTTP API, providing performance and safety.
- TypeScript (React/PatternFly): Powers the modern web user interface (UI), ensuring a consistent and responsive user experience.
- Ruby: Integrates existing, robust YaST libraries (e.g.,
yast-storage-ng) to reuse established functionality.
The Problem: Testing Overhead
Developing and maintaining code across these three languages requires a significant, tedious effort in writing, reviewing, and updating unit tests for each component. This high cost of testing is a drain on developer resources and can slow down the project's evolution.
The Solution: AI-Driven Automation
This project aims to eliminate the manual overhead of unit testing by exploring and integrating AI-driven code generation tools. We will investigate how AI can:
- Automatically generate new unit tests as code is developed.
- Intelligently correct and update existing unit tests when the application code changes.
By automating this crucial but monotonous task, we can free developers to focus on feature implementation and significantly improve the speed and maintainability of the Agama codebase.
Goals
- Proof of Concept: Successfully integrate and demonstrate an authorized AI tool (e.g.,
gemini-cli) to automatically generate unit tests. - Workflow Integration: Define and document a new unit test automation workflow that seamlessly integrates the selected AI tool into the existing Agama development pipeline.
- Knowledge Sharing: Establish a set of best practices for using AI in code generation, sharing the learned expertise with the broader team.
Contribution & Resources
We are seeking contributors interested in AI-powered development and improving developer efficiency. Whether you have previous experience with code generation tools or are eager to learn, your participation is highly valuable.
If you want to dive deep into AI for software quality, please reach out and join the effort!
- Authorized AI Tools: Tools supported by SUSE (e.g.,
gemini-cli) - Focus Areas: Rust, TypeScript, and Ruby components within the Agama project.
Interesting Links
Uyuni Health-check Grafana AI Troubleshooter by ygutierrez
Description
This project explores the feasibility of using the open-source Grafana LLM plugin to enhance the Uyuni Health-check tool with LLM capabilities. The idea is to integrate a chat-based "AI Troubleshooter" directly into existing dashboards, allowing users to ask natural-language questions about errors, anomalies, or performance issues.
Goals
- Investigate if and how the
grafana-llm-appplug-in can be used within the Uyuni Health-check tool. - Investigate if this plug-in can be used to query LLMs for troubleshooting scenarios.
- Evaluate support for local LLMs and external APIs through the plugin.
- Evaluate if and how the Uyuni MCP server could be integrated as another source of information.
Resources
Multi-agent AI assistant for Linux troubleshooting by doreilly
Description
Explore multi-agent architecture as a way to avoid MCP context rot.
Having one agent with many tools bloats the context with low-level details about tool descriptions, parameter schemas etc which hurts LLM performance. Instead have many specialised agents, each with just the tools it needs for its role. A top level supervisor agent takes the user prompt and delegates to appropriate sub-agents.
Goals
Create an AI assistant with some sub-agents that are specialists at troubleshooting Linux subsystems, e.g. systemd, selinux, firewalld etc. The agents can get information from the system by implementing their own tools with simple function calls, or use tools from MCP servers, e.g. a systemd-agent can use tools from systemd-mcp.
Example prompts/responses:
user$ the system seems slow
assistant$ process foo with pid 12345 is using 1000% cpu ...

user$ I can't connect to the apache webserver
assistant$ the firewall is blocking http ... you can open the port with firewall-cmd --add-port ...
Resources
Language Python. The Python ADK is more mature than Golang.
https://google.github.io/adk-docs/
https://github.com/djoreilly/linux-helper
Extended private brain - RAG my own scripts and data into offline LLM AI by tjyrinki_suse
Description
For purely studying purposes, I'd like to find out if I could teach an LLM some of my own accumulated knowledge, to use it as a sort of extended brain.
I might use qwen3-coder or something similar as a starting point.
Everything would be done 100% offline without network available to the container, since I prefer to see when network is needed, and make it so it's never needed (other than initial downloads).
Goals
- Learn something about RAG, LLM, AI.
- Find out if everything works offline as intended.
- As an end result have a new way to access my own existing know-how, but so that I can query the wisdom in them.
- Be flexible to pivot in any direction, as long as there are new things learned.
Resources
To be found on the fly.
Timeline
Day 1 (of 4)
- Tried out a RAG demo, expanded on feeding it my own data
- Experimented with qwen3-coder to add a persistent chat functionality, and keeping vectors in a pickle file
- Optimizations to keep everything within context window
- Learn and add a bit of PyTest
Day 2
- More experimenting and more data
- Study ChromaDB
- Add a Web UI that works from another computer even though the container sees network is down
Day 3
- The above RAG is working well enough for demonstration purposes.
- Pivot to trying out OpenCode, configuring local Ollama qwen3-coder there, to analyze the RAG demo.
- Figured out how to configure Ollama template to be usable under OpenCode. OpenCode locally is super slow to just running qwen3-coder alone.
Day 4 (final day)
- Battle with OpenCode that was both slow and kept on piling up broken things.
- Call it success as after all the agentic AI was working locally.
- Clean up the mess left behind a bit.
Blog Post
Summarized the findings at blog post.
MCP Server for SCC by digitaltomm
Description
Provide an MCP Server implementation for customers to access data on scc.suse.com via MCP protocol. The core benefit of this MCP interface is that it has direct (read) access to customer data in SCC, so the AI agent gets enhanced knowledge about individual customer data, like subscriptions, orders and registered systems.
Architecture
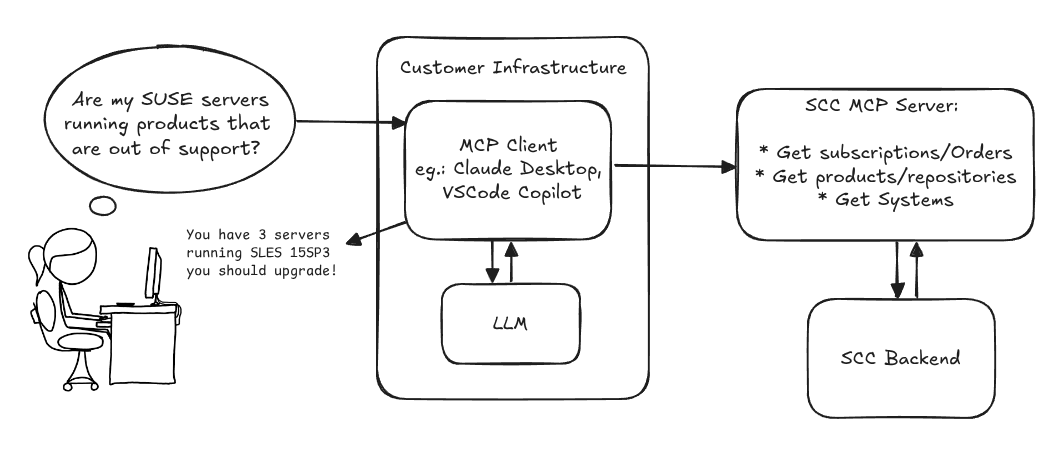
Goals
We want to demonstrate a proof of concept to connect to the SCC MCP server with any AI agent, for example gemini-cli or codex. Enabling the user to ask questions regarding their SCC inventory.
For this Hackweek, we target that users get proper responses to these example questions:
- Which of my currently active systems are running products that are out of support?
- Do I have ready to use registration codes for SLES?
- What are the latest 5 released patches for SLES 15 SP6? Output as a list with release date, patch name, affected package names and fixed CVEs.
- Which versions of kernel-default are available on SLES 15 SP6?
Technical Notes
Similar to the organization APIs, this can expose to customers data about their subscriptions, orders, systems and products. Authentication should be done by organization credentials, similar to what needs to be provided to RMT/MLM. Customers can connect to the SCC MCP server from their own MCP-compatible client and Large Language Model (LLM), so no third party is involved.
Milestones
[x] Basic MCP API setup
  MCP endpoints
  [x] Products / Repositories
  [x] Subscriptions / Orders
  [x] Systems
  [x] Packages
[x] Document usage with Gemini CLI, Codex
Resources
Gemini CLI setup:
~/.gemini/settings.json: