Starting from prometheus ( and grafana if needed), learn how to monitor kubernetes and docker and do some valid alert/graph etc.
https://docs.docker.com/config/thirdparty/prometheus/

Looking for hackers with the skills:
This project is part of:
Hack Week 17
Activity
Comments
Be the first to comment!
Similar Projects
terraform-provider-feilong by e_bischoff
Project Description
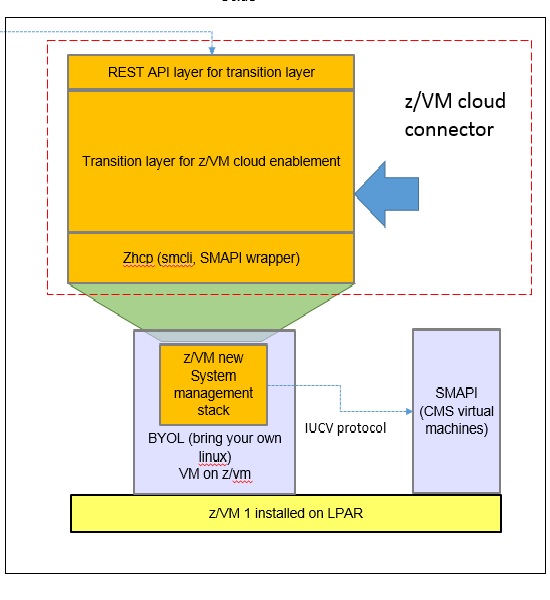
People need to test operating systems and applications on s390 platform. While this is straightforward with KVM, this is very difficult with z/VM.
IBM Cloud Infrastructure Center (ICIC) harnesses the Feilong API, but you can use Feilong without installing ICIC(see this schema).
What about writing a terraform Feilong provider, just like we have the terraform libvirt provider? That would allow to transparently call Feilong from your main.tf files to deploy and destroy resources on your z/VM system.
Goal for Hackweek 23
I would like to be able to easily deploy and provision VMs automatically on a z/VM system, in a way that people might enjoy even outside of SUSE.
My technical preference is to write a terraform provider plugin, as it is the approach that involves the least software components for our deployments, while remaining clean, and compatible with our existing development infrastructure.
Goals for Hackweek 24
Feilong provider works and is used internally by SUSE Manager team. Let's push it forward!
Let's add support for fiberchannel disks and multipath.
Goals for Hackweek 25
Modernization, maturity, and maintenance: support for SLES 16 and openTofu, new API calls, fixes...
Resources
Outcome
A CLI for Harvester by mohamed.belgaied
Harvester does not officially come with a CLI tool, the user is supposed to interact with Harvester mostly through the UI. Though it is theoretically possible to use kubectl to interact with Harvester, the manipulation of Kubevirt YAML objects is absolutely not user friendly. Inspired by tools like multipass from Canonical to easily and rapidly create one of multiple VMs, I began the development of Harvester CLI. Currently, it works but Harvester CLI needs some love to be up-to-date with Harvester v1.0.2 and needs some bug fixes and improvements as well.
Project Description
Harvester CLI is a command line interface tool written in Go, designed to simplify interfacing with a Harvester cluster as a user. It is especially useful for testing purposes as you can easily and rapidly create VMs in Harvester by providing a simple command such as:
harvester vm create my-vm --count 5
to create 5 VMs named my-vm-01 to my-vm-05.

Harvester CLI is functional but needs a number of improvements: up-to-date functionality with Harvester v1.0.2 (some minor issues right now), modifying the default behaviour to create an opensuse VM instead of an ubuntu VM, solve some bugs, etc.
Github Repo for Harvester CLI: https://github.com/belgaied2/harvester-cli
Done in previous Hackweeks
- Create a Github actions pipeline to automatically integrate Harvester CLI to Homebrew repositories: DONE
- Automatically package Harvester CLI for OpenSUSE / Redhat RPMs or DEBs: DONE
Goal for this Hackweek
The goal for this Hackweek is to bring Harvester CLI up-to-speed with latest Harvester versions (v1.3.X and v1.4.X), and improve the code quality as well as implement some simple features and bug fixes.
Some nice additions might be: * Improve handling of namespaced objects * Add features, such as network management or Load Balancer creation ? * Add more unit tests and, why not, e2e tests * Improve CI * Improve the overall code quality * Test the program and create issues for it
Issue list is here: https://github.com/belgaied2/harvester-cli/issues
Resources
The project is written in Go, and using client-go the Kubernetes Go Client libraries to communicate with the Harvester API (which is Kubernetes in fact).
Welcome contributions are:
- Testing it and creating issues
- Documentation
- Go code improvement
What you might learn
Harvester CLI might be interesting to you if you want to learn more about:
- GitHub Actions
- Harvester as a SUSE Product
- Go programming language
- Kubernetes API
- Kubevirt API objects (Manipulating VMs and VM Configuration in Kubernetes using Kubevirt)
Play with the userfaultfd(2) system call and download on demand using HTTP Range Requests with Golang by rbranco
Description
The userfaultfd(2) is a cool system call to handle page faults in user-space. This should allow me to list the contents of an ISO or similar archive without downloading the whole thing. The userfaultfd(2) part can also be done in theory with the PROT_NONE mprotect + SIGSEGV trick, for complete Unix portability, though reportedly being slower.
Goals
- Create my own library for userfaultfd(2) in Golang.
- Create my own library for HTTP Range Requests.
- Complete portability with Unix.
- Benchmarks.
- Contribute some tests to LTP.
Resources
- https://docs.kernel.org/admin-guide/mm/userfaultfd.html
- https://www.cons.org/cracauer/cracauer-userfaultfd.html
Rewrite Distrobox in go (POC) by fabriziosestito
Description
Rewriting Distrobox in Go.
Main benefits:
- Easier to maintain and to test
- Adapter pattern for different container backends (LXC, systemd-nspawn, etc.)
Goals
- Build a minimal starting point with core commands
- Keep the CLI interface compatible: existing users shouldn't notice any difference
- Use a clean Go architecture with adapters for different container backends
- Keep dependencies minimal and binary size small
- Benchmark against the original shell script
Resources
- Upstream project: https://github.com/89luca89/distrobox/
- Distrobox site: https://distrobox.it/
- ArchWiki: https://wiki.archlinux.org/title/Distrobox
SUSE Health Check Tools by roseswe
SUSE HC Tools Overview
A collection of tools written in Bash or Go 1.24++ to make life easier with handling of a bunch of tar.xz balls created by supportconfig.
Background: For SUSE HC we receive a bunch of supportconfig tar balls to check them for misconfiguration, areas for improvement or future changes.
Main focus on these HC are High Availability (pacemaker), SLES itself and SAP workloads, esp. around the SUSE best practices.
Goals
- Overall improvement of the tools
- Adding new collectors
- Add support for SLES16
Resources
csv2xls* example.sh go.mod listprodids.txt sumtext* trails.go README.md csv2xls.go exceltest.go go.sum m.sh* sumtext.go vercheck.py* config.ini csvfiles/ getrpm* listprodids* rpmdate.sh* sumxls* verdriver* credtest.go example.py getrpm.go listprodids.go sccfixer.sh* sumxls.go verdriver.go
docollall.sh* extracthtml.go gethostnamectl* go.sum numastat.go cpuvul* extractcluster.go firmwarebug* gethostnamectl.go m.sh* numastattest.go cpuvul.go extracthtml* firmwarebug.go go.mod numastat* xtr_cib.sh*
$ getrpm -r pacemaker
>> Product ID: 2795 (SUSE Linux Enterprise Server for SAP Applications 15 SP7 x86_64), RPM Name:
+--------------+----------------------------+--------+--------------+--------------------+
| Package Name | Version                    | Arch   | Release      | Repository         |
+--------------+----------------------------+--------+--------------+--------------------+
| pacemaker    | 2.1.10+20250718.fdf796ebc8 | x86_64 | 150700.3.3.1 | sle-ha/15.7/x86_64 |
| pacemaker    | 2.1.9+20250410.471584e6a2  | x86_64 | 150700.1.9   | sle-ha/15.7/x86_64 |
+--------------+----------------------------+--------+--------------+--------------------+
Total packages found: 2
Flaky Tests AI Finder for Uyuni and MLM Test Suites by oscar-barrios
Description
Our current Grafana dashboards provide a great overview of test suite health, including a panel for "Top failed tests." However, identifying which of these failures are due to legitimate bugs versus intermittent "flaky tests" is a manual, time-consuming process. These flaky tests erode trust in our test suites and slow down development.
This project aims to build a simple but powerful Python script that automates flaky test detection. The script will directly query our Prometheus instance for the historical data of each failed test, using the jenkins_build_test_case_failure_age metric. It will then format this data and send it to the Gemini API with a carefully crafted prompt, asking it to identify which tests show a flaky pattern.
The final output will be a clean JSON list of the most probable flaky tests, which can then be used to populate a new "Top Flaky Tests" panel in our existing Grafana test suite dashboard.
Goals
By the end of Hack Week, we aim to have a single, working Python script that:
- Connects to Prometheus and executes a query to fetch detailed test failure history.
- Processes the raw data into a format suitable for the Gemini API.
- Successfully calls the Gemini API with the data and a clear prompt.
- Parses the AI's response to extract a simple list of flaky tests.
- Saves the list to a JSON file that can be displayed in Grafana.
- New panel in our Dashboard listing the Flaky tests
Resources
- Jenkins Prometheus Exporter: https://github.com/uyuni-project/jenkins-exporter/
- Data Source: Our internal Prometheus server.
- Key Metric:
jenkins_build_test_case_failure_age{jobname, buildid, suite, case, status, failedsince}. - Existing Query for Reference:
count by (suite) (max_over_time(jenkins_build_test_case_failure_age{status=~"FAILED|REGRESSION", jobname="$jobname"}[$__range])). - AI Model: The Google Gemini API.
- Example about how to interact with Gemini API: https://github.com/srbarrios/FailTale/
- Visualization: Our internal Grafana Dashboard.
- Internal IaC: https://gitlab.suse.de/galaxy/infrastructure/-/tree/master/srv/salt/monitoring
Outcome
- Jenkins Flaky Test Detector: https://github.com/srbarrios/jenkins-flaky-tests-detector and its container
- IaC on MLM Team: https://gitlab.suse.de/galaxy/infrastructure/-/tree/master/srv/salt/monitoring/jenkinsflakytestsdetector?reftype=heads, https://gitlab.suse.de/galaxy/infrastructure/-/blob/master/srv/salt/monitoring/grafana/dashboards/flaky-tests.json?ref_type=heads, and others.
- Grafana Dashboard: https://grafana.mgr.suse.de/d/flaky-tests/flaky-tests-detection @ @ text
Kubernetes-Based ML Lifecycle Automation by lmiranda
Description
This project aims to build a complete end-to-end Machine Learning pipeline running entirely on Kubernetes, using Go, and containerized ML components.
The pipeline will automate the lifecycle of a machine learning model, including:
- Data ingestion/collection
- Model training as a Kubernetes Job
- Model artifact storage in an S3-compatible registry (e.g. Minio)
- A Go-based deployment controller that automatically deploys new model versions to Kubernetes using Rancher
- A lightweight inference service that loads and serves the latest model
- Monitoring of model performance and service health through Prometheus/Grafana
The outcome is a working prototype of an MLOps workflow that demonstrates how AI workloads can be trained, versioned, deployed, and monitored using the Kubernetes ecosystem.
Goals
By the end of Hack Week, the project should:
Produce a fully functional ML pipeline running on Kubernetes with:
- Data collection job
- Training job container
- Storage and versioning of trained models
- Automated deployment of new model versions
- Model inference API service
- Basic monitoring dashboards
Showcase a Go-based deployment automation component, which scans the model registry and automatically generates & applies Kubernetes manifests for new model versions.
Enable continuous improvement by making the system modular and extensible (e.g., additional models, metrics, autoscaling, or drift detection can be added later).
Prepare a short demo explaining the end-to-end process and how new models flow through the system.
Resources
Updates
- Training pipeline and datasets
- Inference Service py
Self-Scaling LLM Infrastructure Powered by Rancher by ademicev0
Self-Scaling LLM Infrastructure Powered by Rancher

Description
The Problem
Running LLMs can get expensive and complex pretty quickly.
Today there are typically two choices:
- Use cloud APIs like OpenAI or Anthropic. Easy to start with, but costs add up at scale.
- Self-host everything - set up Kubernetes, figure out GPU scheduling, handle scaling, manage model serving... it's a lot of work.
What if there was a middle ground?
What if infrastructure scaled itself instead of making you scale it?
Can we use existing Rancher capabilities like CAPI, autoscaling, and GitOps to make this simpler instead of building everything from scratch?
Project Repository: github.com/alexander-demicev/llmserverless
What This Project Does
A key feature is hybrid deployment: requests can be routed based on complexity or privacy needs. Simple or low-sensitivity queries can use public APIs (like OpenAI), while complex or private requests are handled in-house on local infrastructure. This flexibility allows balancing cost, privacy, and performance - using cloud for routine tasks and on-premises resources for sensitive or demanding workloads.
A complete, self-scaling LLM infrastructure that:
- Scales to zero when idle (no idle costs)
- Scales up automatically when requests come in
- Adds more nodes when needed, removes them when demand drops
- Runs on any infrastructure - laptop, bare metal, or cloud
Think of it as "serverless for LLMs" - focus on building, the infrastructure handles itself.
How It Works
A combination of open source tools working together:
Flow:
- Users interact with OpenWebUI (chat interface)
- Requests go to LiteLLM Gateway
- LiteLLM routes requests to:
- Ollama (Knative) for local model inference (auto-scales pods)
- Or cloud APIs for fallback
A CLI for Harvester by mohamed.belgaied
Harvester does not officially come with a CLI tool, the user is supposed to interact with Harvester mostly through the UI. Though it is theoretically possible to use kubectl to interact with Harvester, the manipulation of Kubevirt YAML objects is absolutely not user friendly. Inspired by tools like multipass from Canonical to easily and rapidly create one of multiple VMs, I began the development of Harvester CLI. Currently, it works but Harvester CLI needs some love to be up-to-date with Harvester v1.0.2 and needs some bug fixes and improvements as well.
Project Description
Harvester CLI is a command line interface tool written in Go, designed to simplify interfacing with a Harvester cluster as a user. It is especially useful for testing purposes as you can easily and rapidly create VMs in Harvester by providing a simple command such as:
harvester vm create my-vm --count 5
to create 5 VMs named my-vm-01 to my-vm-05.
Harvester CLI is functional but needs a number of improvements: up-to-date functionality with Harvester v1.0.2 (some minor issues right now), modifying the default behaviour to create an opensuse VM instead of an ubuntu VM, solve some bugs, etc.
Github Repo for Harvester CLI: https://github.com/belgaied2/harvester-cli
Done in previous Hackweeks
- Create a Github actions pipeline to automatically integrate Harvester CLI to Homebrew repositories: DONE
- Automatically package Harvester CLI for OpenSUSE / Redhat RPMs or DEBs: DONE
Goal for this Hackweek
The goal for this Hackweek is to bring Harvester CLI up-to-speed with latest Harvester versions (v1.3.X and v1.4.X), and improve the code quality as well as implement some simple features and bug fixes.
Some nice additions might be: * Improve handling of namespaced objects * Add features, such as network management or Load Balancer creation ? * Add more unit tests and, why not, e2e tests * Improve CI * Improve the overall code quality * Test the program and create issues for it
Issue list is here: https://github.com/belgaied2/harvester-cli/issues
Resources
The project is written in Go, and using client-go the Kubernetes Go Client libraries to communicate with the Harvester API (which is Kubernetes in fact).
Welcome contributions are:
- Testing it and creating issues
- Documentation
- Go code improvement
What you might learn
Harvester CLI might be interesting to you if you want to learn more about:
- GitHub Actions
- Harvester as a SUSE Product
- Go programming language
- Kubernetes API
- Kubevirt API objects (Manipulating VMs and VM Configuration in Kubernetes using Kubevirt)
OpenPlatform Self-Service Portal by tmuntan1
Description
In SUSE IT, we developed an internal developer platform for our engineers using SUSE technologies such as RKE2, SUSE Virtualization, and Rancher. While it works well for our existing users, the onboarding process could be better.
To improve our customer experience, I would like to build a self-service portal to make it easy for people to accomplish common actions. To get started, I would have the portal create Jira SD tickets for our customers to have better information in our tickets, but eventually I want to add automation to reduce our workload.
Goals
- Build a frontend website (Angular) that helps customers create Jira SD tickets.
- Build a backend (Rust with Axum) for the backend, which would do all the hard work for the frontend.
Resources (SUSE VPN only)
- development site: https://ui-dev.openplatform.suse.com/login?returnUrl=%2Fopenplatform%2Fforms
- https://gitlab.suse.de/itpe/core/open-platform/op-portal/backend
- https://gitlab.suse.de/itpe/core/open-platform/op-portal/frontend
Technical talks at universities by agamez
Description
This project aims to empower the next generation of tech professionals by offering hands-on workshops on containerization and Kubernetes, with a strong focus on open-source technologies. By providing practical experience with these cutting-edge tools and fostering a deep understanding of open-source principles, we aim to bridge the gap between academia and industry.
For now, the scope is limited to Spanish universities, since we already have the contacts and have started some conversations.
Goals
- Technical Skill Development: equip students with the fundamental knowledge and skills to build, deploy, and manage containerized applications using open-source tools like Kubernetes.
- Open-Source Mindset: foster a passion for open-source software, encouraging students to contribute to open-source projects and collaborate with the global developer community.
- Career Readiness: prepare students for industry-relevant roles by exposing them to real-world use cases, best practices, and open-source in companies.
Resources
- Instructors: experienced open-source professionals with deep knowledge of containerization and Kubernetes.
- SUSE Expertise: leverage SUSE's expertise in open-source technologies to provide insights into industry trends and best practices.
Uyuni Health-check Grafana AI Troubleshooter by ygutierrez
Description
This project explores the feasibility of using the open-source Grafana LLM plugin to enhance the Uyuni Health-check tool with LLM capabilities. The idea is to integrate a chat-based "AI Troubleshooter" directly into existing dashboards, allowing users to ask natural-language questions about errors, anomalies, or performance issues.
Goals
- Investigate if and how the
grafana-llm-appplug-in can be used within the Uyuni Health-check tool. - Investigate if this plug-in can be used to query LLMs for troubleshooting scenarios.
- Evaluate support for local LLMs and external APIs through the plugin.
- Evaluate if and how the Uyuni MCP server could be integrated as another source of information.
Resources
Flaky Tests AI Finder for Uyuni and MLM Test Suites by oscar-barrios
Description
Our current Grafana dashboards provide a great overview of test suite health, including a panel for "Top failed tests." However, identifying which of these failures are due to legitimate bugs versus intermittent "flaky tests" is a manual, time-consuming process. These flaky tests erode trust in our test suites and slow down development.
This project aims to build a simple but powerful Python script that automates flaky test detection. The script will directly query our Prometheus instance for the historical data of each failed test, using the jenkins_build_test_case_failure_age metric. It will then format this data and send it to the Gemini API with a carefully crafted prompt, asking it to identify which tests show a flaky pattern.
The final output will be a clean JSON list of the most probable flaky tests, which can then be used to populate a new "Top Flaky Tests" panel in our existing Grafana test suite dashboard.
Goals
By the end of Hack Week, we aim to have a single, working Python script that:
- Connects to Prometheus and executes a query to fetch detailed test failure history.
- Processes the raw data into a format suitable for the Gemini API.
- Successfully calls the Gemini API with the data and a clear prompt.
- Parses the AI's response to extract a simple list of flaky tests.
- Saves the list to a JSON file that can be displayed in Grafana.
- New panel in our Dashboard listing the Flaky tests
Resources
- Jenkins Prometheus Exporter: https://github.com/uyuni-project/jenkins-exporter/
- Data Source: Our internal Prometheus server.
- Key Metric:
jenkins_build_test_case_failure_age{jobname, buildid, suite, case, status, failedsince}. - Existing Query for Reference:
count by (suite) (max_over_time(jenkins_build_test_case_failure_age{status=~"FAILED|REGRESSION", jobname="$jobname"}[$__range])). - AI Model: The Google Gemini API.
- Example about how to interact with Gemini API: https://github.com/srbarrios/FailTale/
- Visualization: Our internal Grafana Dashboard.
- Internal IaC: https://gitlab.suse.de/galaxy/infrastructure/-/tree/master/srv/salt/monitoring
Outcome
- Jenkins Flaky Test Detector: https://github.com/srbarrios/jenkins-flaky-tests-detector and its container
- IaC on MLM Team: https://gitlab.suse.de/galaxy/infrastructure/-/tree/master/srv/salt/monitoring/jenkinsflakytestsdetector?reftype=heads, https://gitlab.suse.de/galaxy/infrastructure/-/blob/master/srv/salt/monitoring/grafana/dashboards/flaky-tests.json?ref_type=heads, and others.
- Grafana Dashboard: https://grafana.mgr.suse.de/d/flaky-tests/flaky-tests-detection @ @ text