Description
In SUMA/Uyuni team we spend a lot of time reviewing test reports, analyzing each of the test cases failing, checking if the test is a flaky test, checking logs, etc.
Goals
Speed up the review by automating some parts through AI, in a way that we can consume some summary of that report that could be meaningful for the reviewer.
Resources
No idea about the resources yet, but we will make use of:
- HTML/JSON Report (text + screenshots)
- The Test Suite Status GithHub board (via API)
- The environment tested (via SSH)
- The test framework code (via files)
No Hackers yet
This project is part of:
Hack Week 24
Activity
Comments
-

-
2 months ago by oscar-barrios | Reply
I end up continuing this project on my free time, and I made some progress here: https://github.com/srbarrios/FailTale
Similar Projects
Enable more features in mcp-server-uyuni by j_renner
Description
I would like to contribute to mcp-server-uyuni, the MCP server for Uyuni / Multi-Linux Manager) exposing additional features as tools. There is lots of relevant features to be found throughout the API, for example:
- System operations and infos
- System groups
- Maintenance windows
- Ansible
- Reporting
- ...
At the end of the week I managed to enable basic system group operations:
- List all system groups visible to the user
- Create new system groups
- List systems assigned to a group
- Add and remove systems from groups
Goals
- Set up test environment locally with the MCP server and client + a recent MLM server [DONE]
- Identify features and use cases offering a benefit with limited effort required for enablement [DONE]
- Create a PR to the repo [DONE]
Resources
Flaky Tests AI Finder for Uyuni and MLM Test Suites by oscar-barrios
Description
Our current Grafana dashboards provide a great overview of test suite health, including a panel for "Top failed tests." However, identifying which of these failures are due to legitimate bugs versus intermittent "flaky tests" is a manual, time-consuming process. These flaky tests erode trust in our test suites and slow down development.
This project aims to build a simple but powerful Python script that automates flaky test detection. The script will directly query our Prometheus instance for the historical data of each failed test, using the jenkins_build_test_case_failure_age metric. It will then format this data and send it to the Gemini API with a carefully crafted prompt, asking it to identify which tests show a flaky pattern.
The final output will be a clean JSON list of the most probable flaky tests, which can then be used to populate a new "Top Flaky Tests" panel in our existing Grafana test suite dashboard.
Goals
By the end of Hack Week, we aim to have a single, working Python script that:
- Connects to Prometheus and executes a query to fetch detailed test failure history.
- Processes the raw data into a format suitable for the Gemini API.
- Successfully calls the Gemini API with the data and a clear prompt.
- Parses the AI's response to extract a simple list of flaky tests.
- Saves the list to a JSON file that can be displayed in Grafana.
- New panel in our Dashboard listing the Flaky tests
Resources
- Jenkins Prometheus Exporter: https://github.com/uyuni-project/jenkins-exporter/
- Data Source: Our internal Prometheus server.
- Key Metric:
jenkins_build_test_case_failure_age{jobname, buildid, suite, case, status, failedsince}. - Existing Query for Reference:
count by (suite) (max_over_time(jenkins_build_test_case_failure_age{status=~"FAILED|REGRESSION", jobname="$jobname"}[$__range])). - AI Model: The Google Gemini API.
- Example about how to interact with Gemini API: https://github.com/srbarrios/FailTale/
- Visualization: Our internal Grafana Dashboard.
- Internal IaC: https://gitlab.suse.de/galaxy/infrastructure/-/tree/master/srv/salt/monitoring
Outcome
- Jenkins Flaky Test Detector: https://github.com/srbarrios/jenkins-flaky-tests-detector and its container
- IaC on MLM Team: https://gitlab.suse.de/galaxy/infrastructure/-/tree/master/srv/salt/monitoring/jenkinsflakytestsdetector?reftype=heads, https://gitlab.suse.de/galaxy/infrastructure/-/blob/master/srv/salt/monitoring/grafana/dashboards/flaky-tests.json?ref_type=heads, and others.
- Grafana Dashboard: https://grafana.mgr.suse.de/d/flaky-tests/flaky-tests-detection @ @ text
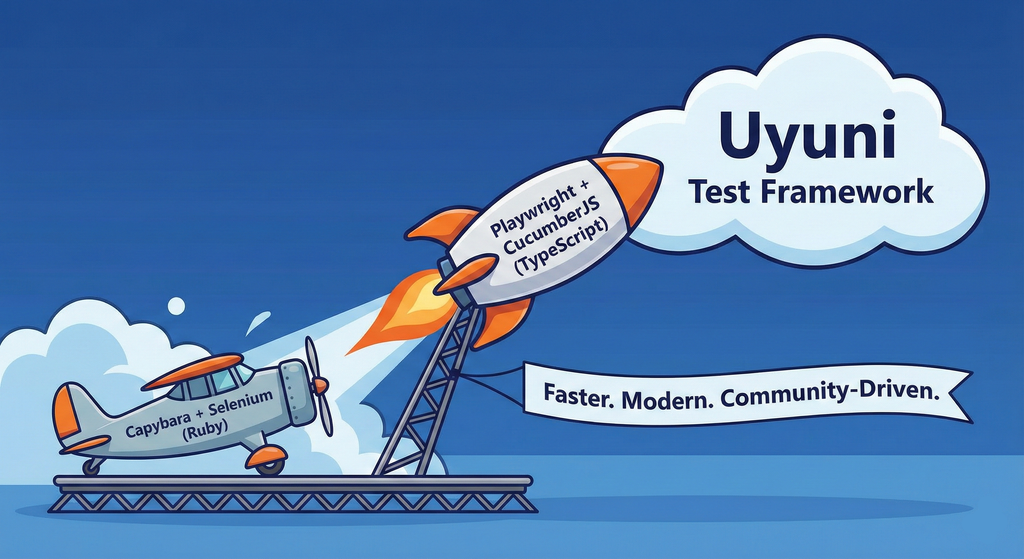
Move Uyuni Test Framework from Selenium to Playwright + AI by oscar-barrios
Description
This project aims to migrate the existing Uyuni Test Framework from Selenium to Playwright. The move will improve the stability, speed, and maintainability of our end-to-end tests by leveraging Playwright's modern features. We'll be rewriting the current Selenium code in Ruby to Playwright code in TypeScript, which includes updating the test framework runner, step definitions, and configurations. This is also necessary because we're moving from Cucumber Ruby to CucumberJS.
If you're still curious about the AI in the title, it was just a way to grab your attention. Thanks for your understanding.
Nah, let's be honest ![]() AI helped a lot to vibe code a good part of the Ruby methods of the Test framework, moving them to Typescript, along with the migration from Capybara to Playwright. I've been using "Cline" as plugin for WebStorm IDE, using Gemini API behind it.
AI helped a lot to vibe code a good part of the Ruby methods of the Test framework, moving them to Typescript, along with the migration from Capybara to Playwright. I've been using "Cline" as plugin for WebStorm IDE, using Gemini API behind it.
Goals
- Migrate Core tests including Onboarding of clients
- Improve test reliabillity: Measure and confirm a significant reduction of flakiness.
- Implement a robust framework: Establish a well-structured and reusable Playwright test framework using the CucumberJS
Resources
- Existing Uyuni Test Framework (Cucumber Ruby + Capybara + Selenium)
- My Template for CucumberJS + Playwright in TypeScript
- Started Hackweek Project
Set Up an Ephemeral Uyuni Instance by mbussolotto
Description
To test, check, and verify the latest changes in the master branch, we want to easily set up an ephemeral environment.
Goals
- Create an ephemeral environment manually
Create an ephemeral environment automatically
Resources
https://github.com/uyuni-project/uyuni
https://www.uyuni-project.org/uyuni-docs/en/uyuni/index.html
Enhance setup wizard for Uyuni by PSuarezHernandez
Description
This project wants to enhance the intial setup on Uyuni after its installation, so it's easier for a user to start using with it.
Uyuni currently uses "uyuni-tools" (mgradm) as the installation entrypoint, to trigger the installation of Uyuni in the given host, but does not really perform an initial setup, for instance:
- user creation
- adding products / channels
- generating bootstrap repos
- create activation keys
- ...
Goals
- Provide initial setup wizard as part of mgradm uyuni installation
Resources
Bugzilla goes AI - Phase 1 by nwalter
Description
This project, Bugzilla goes AI, aims to boost developer productivity by creating an autonomous AI bug agent during Hackweek. The primary goal is to reduce the time employees spend triaging bugs by integrating Ollama to summarize issues, recommend next steps, and push focused daily reports to a Web Interface.
Goals
To reduce employee time spent on Bugzilla by implementing an AI tool that triages and summarizes bug reports, providing actionable recommendations to the team via Web Interface.
Project Charter
Description
Project Achievements during Hackweek
In this file you can read about what we achieved during Hackweek.
Explore LLM evaluation metrics by thbertoldi
Description
Learn the best practices for evaluating LLM performance with an open-source framework such as DeepEval.
Goals
Curate the knowledge learned during practice and present it to colleagues.
-> Maybe publish a blog post on SUSE's blog?
Resources
https://deepeval.com
https://docs.pactflow.io/docs/bi-directional-contract-testing
Song Search with CLAP by gcolangiuli
Description
Contrastive Language-Audio Pretraining (CLAP) is an open-source library that enables the training of a neural network on both Audio and Text descriptions, making it possible to search for Audio using a Text input. Several pre-trained models for song search are already available on huggingface

Goals
Evaluate how CLAP can be used for song searching and determine which types of queries yield the best results by developing a Minimum Viable Product (MVP) in Python. Based on the results of this MVP, future steps could include:
- Music Tagging;
- Free text search;
- Integration with an LLM (for example, with MCP or the OpenAI API) for music suggestions based on your own library.
The code for this project will be entirely written using AI to better explore and demonstrate AI capabilities.
Result
In this MVP we implemented:
- Async Song Analysis with Clap model
- Free Text Search of the songs
- Similar song search based on vector representation
- Containerised version with web interface
We also documented what went well and what can be improved in the use of AI.
You can have a look at the result here:
Future implementation can be related to performance improvement and stability of the analysis.
References
- CLAP: The main model being researched;
- huggingface: Pre-trained models for CLAP;
- Free Music Archive: Creative Commons songs that can be used for testing;
GenAI-Powered Systemic Bug Evaluation and Management Assistant by rtsvetkov
Motivation
What is the decision critical question which one can ask on a bug? How this question affects the decision on a bug and why?
Let's make GenAI look on the bug from the systemic point and evaluate what we don't know. Which piece of information is missing to take a decision?
Description
To build a tool that takes a raw bug report (including error messages and context) and uses a large language model (LLM) to generate a series of structured, Socratic-style or Systemic questions designed to guide a the integration and development toward the root cause, rather than just providing a direct, potentially incorrect fix.
Goals
Set up a Python environment
Set the environment and get a Gemini API key. 2. Collect 5-10 realistic bug reports (from open-source projects, personal projects, or public forums like Stack Overflow—include the error message and the initial context).
Build the Dialogue Loop
- Write a basic Python script using the Gemini API.
- Implement a simple conversational loop: User Input (Bug) -> AI Output (Question) -> User Input (Answer to AI's question) -> AI Output (Next Question). Code Implementation
Socratic/Systemic Strategy Implementation
- Refine the logic to ensure the questions follow a Socratic and Systemic path (e.g., from symptom-> context -> assumptions -> -> critical parts -> ).
- Implement Function Calling (an advanced feature of the Gemini API) to suggest specific actions to the user, like "Run a ping test" or "Check the database logs."
- Implement Bugzillla call to collect the
- Implement Questioning Framework as LLVM pre-conditioning
- Define set of instructions
- Assemble the Tool
Resources
What are Systemic Questions?
Systemic questions explore the relationships, patterns, and interactions within a system rather than focusing on isolated elements.
In IT, they help uncover hidden dependencies, feedback loops, assumptions, and side-effects during debugging or architecture analysis.
Gitlab Project
gitlab.suse.de/sle-prjmgr/BugDecisionCritical_Question
Uyuni Health-check Grafana AI Troubleshooter by ygutierrez
Description
This project explores the feasibility of using the open-source Grafana LLM plugin to enhance the Uyuni Health-check tool with LLM capabilities. The idea is to integrate a chat-based "AI Troubleshooter" directly into existing dashboards, allowing users to ask natural-language questions about errors, anomalies, or performance issues.
Goals
- Investigate if and how the
grafana-llm-appplug-in can be used within the Uyuni Health-check tool. - Investigate if this plug-in can be used to query LLMs for troubleshooting scenarios.
- Evaluate support for local LLMs and external APIs through the plugin.
- Evaluate if and how the Uyuni MCP server could be integrated as another source of information.
Resources
openQA tests needles elaboration using AI image recognition by mdati
Description
In the openQA test framework, to identify the status of a target SUT image, a screenshots of GUI or CLI-terminal images,
the needles framework scans the many pictures in its repository, having associated a given set of tags (strings), selecting specific smaller parts of each available image. For the needles management actually we need to keep stored many screenshots, variants of GUI and CLI-terminal images, eachone accompanied by a dedicated set of data references (json).
A smarter framework, using image recognition based on AI or other image elaborations tools, nowadays widely available, could improve the matching process and hopefully reduce time and errors, during the images verification and detection process.
Goals
Main scope of this idea is to match a "graphical" image of the console or GUI status of a running openQA test, an image of a shell console or application-GUI screenshot, using less time and resources and with less errors in data preparation and use, than the actual openQA needles framework; that is:
- having a given SUT (system under test) GUI or CLI-terminal screenshot, with a local distribution of pixels or text commands related to a running test status,
- we want to identify a desired target, e.g. a screen image status or data/commands context,
- based on AI/ML-pretrained archives containing object or other proper elaboration tools,
- possibly able to identify also object not present in the archive, i.e. by means of AI/ML mechanisms.
- the matching result should be then adapted to continue working in the openQA test, likewise and in place of the same result that would have been produced by the original openQA needles framework.
- We expect an improvement of the matching-time(less time), reliability of the expected result(less error) and simplification of archive maintenance in adding/removing objects(smaller DB and less actions).
Hackweek POC:
Main steps
- Phase 1 - Plan
- study the available tools
- prepare a plan for the process to build
- Phase 2 - Implement
- write and build a draft application
- Phase 3 - Data
- prepare the data archive from a subset of needles
- initialize/pre-train the base archive
- select a screenshot from the subset, removing/changing some part
- Phase 4 - Test
- run the POC application
- expect the image type is identified in a good %.
Resources
First step of this project is quite identification of useful resources for the scope; some possibilities are:
- SUSE AI and other ML tools (i.e. Tensorflow)
- Tools able to manage images
- RPA test tools (like i.e. Robot framework)
- other.
Project references
- Repository: openqa-needles-AI-driven
Multimachine on-prem test with opentofu, ansible and Robot Framework by apappas
Description
A long time ago I explored using the Robot Framework for testing. A big deficiency over our openQA setup is that bringing up and configuring the connection to a test machine is out of scope.
Nowadays we have a way¹ to deploy SUTs outside openqa, but we only use if for cloud tests in conjuction with openqa. Using knowledge gained from that project I am going to try to create a test scenario that replicates an openqa test but this time including the deployment and setup of the SUT.
Goals
Create a simple multimachine test scenario with the support server and SUT all created by the robot framework.
Resources
- https://github.com/SUSE/qe-sap-deployment
- terraform-libvirt-provider
Testing and adding GNU/Linux distributions on Uyuni by juliogonzalezgil
Join the Gitter channel! https://gitter.im/uyuni-project/hackweek
Uyuni is a configuration and infrastructure management tool that saves you time and headaches when you have to manage and update tens, hundreds or even thousands of machines. It also manages configuration, can run audits, build image containers, monitor and much more!
Currently there are a few distributions that are completely untested on Uyuni or SUSE Manager (AFAIK) or just not tested since a long time, and could be interesting knowing how hard would be working with them and, if possible, fix whatever is broken.
For newcomers, the easiest distributions are those based on DEB or RPM packages. Distributions with other package formats are doable, but will require adapting the Python and Java code to be able to sync and analyze such packages (and if salt does not support those packages, it will need changes as well). So if you want a distribution with other packages, make sure you are comfortable handling such changes.
No developer experience? No worries! We had non-developers contributors in the past, and we are ready to help as long as you are willing to learn. If you don't want to code at all, you can also help us preparing the documentation after someone else has the initial code ready, or you could also help with testing :-)
The idea is testing Salt (including bootstrapping with bootstrap script) and Salt-ssh clients
To consider that a distribution has basic support, we should cover at least (points 3-6 are to be tested for both salt minions and salt ssh minions):
- Reposync (this will require using spacewalk-common-channels and adding channels to the .ini file)
- Onboarding (salt minion from UI, salt minion from bootstrap scritp, and salt-ssh minion) (this will probably require adding OS to the bootstrap repository creator)
- Package management (install, remove, update...)
- Patching
- Applying any basic salt state (including a formula)
- Salt remote commands
- Bonus point: Java part for product identification, and monitoring enablement
- Bonus point: sumaform enablement (https://github.com/uyuni-project/sumaform)
- Bonus point: Documentation (https://github.com/uyuni-project/uyuni-docs)
- Bonus point: testsuite enablement (https://github.com/uyuni-project/uyuni/tree/master/testsuite)
If something is breaking: we can try to fix it, but the main idea is research how supported it is right now. Beyond that it's up to each project member how much to hack :-)
- If you don't have knowledge about some of the steps: ask the team
- If you still don't know what to do: switch to another distribution and keep testing.
This card is for EVERYONE, not just developers. Seriously! We had people from other teams helping that were not developers, and added support for Debian and new SUSE Linux Enterprise and openSUSE Leap versions :-)
In progress/done for Hack Week 25
Guide
We started writin a Guide: Adding a new client GNU Linux distribution to Uyuni at https://github.com/uyuni-project/uyuni/wiki/Guide:-Adding-a-new-client-GNU-Linux-distribution-to-Uyuni, to make things easier for everyone, specially those not too familiar wht Uyuni or not technical.
openSUSE Leap 16.0
The distribution will all love!
https://en.opensuse.org/openSUSE:Roadmap#DRAFTScheduleforLeap16.0
Curent Status We started last year, it's complete now for Hack Week 25! :-D
[W]Reposync (this will require using spacewalk-common-channels and adding channels to the .ini file) NOTE: Done, client tools for SLMicro6 are using as those for SLE16.0/openSUSE Leap 16.0 are not available yet[W]Onboarding (salt minion from UI, salt minion from bootstrap scritp, and salt-ssh minion) (this will probably require adding OS to the bootstrap repository creator)[W]Package management (install, remove, update...). Works, even reboot requirement detection