Project Description
The goal is to have a language model, that is able to answer technical questions on Uyuni. Uyuni documentation is too large for in-context processing, so finetuning is the way to go.
Goal for this Hackweek
Finetune a model based on llama-2-7b.
Resources
No Hackers yet
This project is part of:
Hack Week 23
Comments
Be the first to comment!
Similar Projects
Kubernetes-Based ML Lifecycle Automation by lmiranda
Description
This project aims to build a complete end-to-end Machine Learning pipeline running entirely on Kubernetes, using Go, and containerized ML components.
The pipeline will automate the lifecycle of a machine learning model, including:
- Data ingestion/collection
- Model training as a Kubernetes Job
- Model artifact storage in an S3-compatible registry (e.g. Minio)
- A Go-based deployment controller that automatically deploys new model versions to Kubernetes using Rancher
- A lightweight inference service that loads and serves the latest model
- Monitoring of model performance and service health through Prometheus/Grafana
The outcome is a working prototype of an MLOps workflow that demonstrates how AI workloads can be trained, versioned, deployed, and monitored using the Kubernetes ecosystem.
Goals
By the end of Hack Week, the project should:
Produce a fully functional ML pipeline running on Kubernetes with:
- Data collection job
- Training job container
- Storage and versioning of trained models
- Automated deployment of new model versions
- Model inference API service
- Basic monitoring dashboards
Showcase a Go-based deployment automation component, which scans the model registry and automatically generates & applies Kubernetes manifests for new model versions.
Enable continuous improvement by making the system modular and extensible (e.g., additional models, metrics, autoscaling, or drift detection can be added later).
Prepare a short demo explaining the end-to-end process and how new models flow through the system.
Resources
Updates
- Training pipeline and datasets
- Inference Service py
MCP Server for SCC by digitaltomm
Description
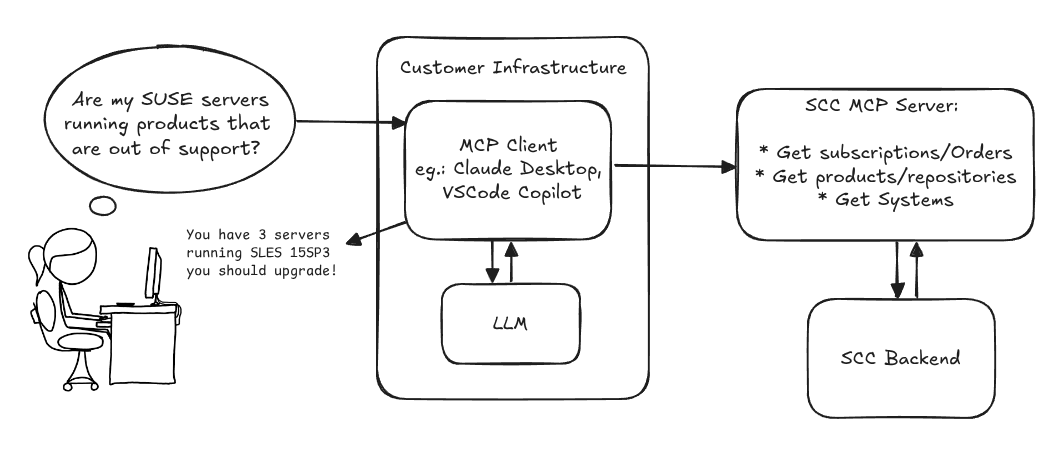
Provide an MCP Server implementation for customers to access data on scc.suse.com via MCP protocol. The core benefit of this MCP interface is that it has direct (read) access to customer data in SCC, so the AI agent gets enhanced knowledge about individual customer data, like subscriptions, orders and registered systems.
Architecture
Goals
We want to demonstrate a proof of concept to connect to the SCC MCP server with any AI agent, for example gemini-cli or codex. Enabling the user to ask questions regarding their SCC inventory.
For this Hackweek, we target that users get proper responses to these example questions:
- Which of my currently active systems are running products that are out of support?
- Do I have ready to use registration codes for SLES?
- What are the latest 5 released patches for SLES 15 SP6? Output as a list with release date, patch name, affected package names and fixed CVEs.
- Which versions of kernel-default are available on SLES 15 SP6?
Technical Notes
Similar to the organization APIs, this can expose to customers data about their subscriptions, orders, systems and products. Authentication should be done by organization credentials, similar to what needs to be provided to RMT/MLM. Customers can connect to the SCC MCP server from their own MCP-compatible client and Large Language Model (LLM), so no third party is involved.
Milestones
[x] Basic MCP API setup
  MCP endpoints
  [x] Products / Repositories
  [x] Subscriptions / Orders
  [x] Systems
  [x] Packages
[x] Document usage with Gemini CLI, Codex
Resources
Gemini CLI setup:
~/.gemini/settings.json:
SUSE Edge Image Builder MCP by eminguez
Description
Based on my other hackweek project, SUSE Edge Image Builder's Json Schema I would like to build also a MCP to be able to generate EIB config files the AI way.
Realistically I don't think I'll be able to have something consumable at the end of this hackweek but at least I would like to start exploring MCPs, the difference between an API and MCP, etc.
Goals
- Familiarize myself with MCPs
- Unrealistic: Have an MCP that can generate an EIB config file
Resources
Result
https://github.com/e-minguez/eib-mcp
I've extensively used antigravity and its agent mode to code this. This heavily uses https://hackweek.opensuse.org/25/projects/suse-edge-image-builder-json-schema for the MCP to be built.
I've ended up learning a lot of things about "prompting", json schemas in general, some golang, MCPs and AI in general :)
Example:
Generate an Edge Image Builder configuration for an ISO image based on slmicro-6.2.iso, targeting x86_64 architecture. The output name should be 'my-edge-image' and it should install to /dev/sda. It should deploy
    a 3 nodes kubernetes cluster with nodes names "node1", "node2" and "node3" as:
    * hostname: node1, IP: 1.1.1.1, role: initializer
    * hostname: node2, IP: 1.1.1.2, role: agent
    * hostname: node3, IP: 1.1.1.3, role: agent
    The kubernetes version should be k3s 1.33.4-k3s1 and it should deploy a cert-manager helm chart (the latest one available according to https://cert-manager.io/docs/installation/helm/). It should create a user
    called "suse" with password "suse" and set ntp to "foo.ntp.org". The VIP address for the API should be 1.2.3.4
Generates:
``` apiVersion: "1.0" image: arch: x86_64 baseImage: slmicro-6.2.iso imageType: iso outputImageName: my-edge-image kubernetes: helm: charts: - name: cert-manager repositoryName: jetstack
issuefs: FUSE filesystem representing issues (e.g. JIRA) for the use with AI agents code-assistants by llansky3
Description
Creating a FUSE filesystem (issuefs) that mounts issues from various ticketing systems (Github, Jira, Bugzilla, Redmine) as files to your local file system.
And why this is good idea?
- User can use favorite command line tools to view and search the tickets from various sources
- User can use AI agents capabilities from your favorite IDE or cli to ask question about the issues, project or functionality while providing relevant tickets as context without extra work.
- User can use it during development of the new features when you let the AI agent to jump start the solution. The issuefs will give the AI agent the context (AI agents just read few more files) about the bug or requested features. No need for copying and pasting issues to user prompt or by using extra MCP tools to access the issues. These you can still do but this approach is on purpose different.

Goals
- Add Github issue support
- Proof the concept/approach by apply the approach on itself using Github issues for tracking and development of new features
- Add support for Bugzilla and Redmine using this approach in the process of doing it. Record a video of it.
- Clean-up and test the implementation and create some documentation
- Create a blog post about this approach
Resources
There is a prototype implementation here. This currently sort of works with JIRA only.
"what is it" file and directory analysis via MCP and local LLM, for console and KDE by rsimai
Description
Users sometimes wonder what files or directories they find on their local PC are good for. If they can't determine from the filename or metadata, there should an easy way to quickly analyze the content and at least guess the meaning. An LLM could help with that, through the use of a filesystem MCP and to-text-converters for typical file types. Ideally this is integrated into the desktop environment but works as well from a console. All data is processed locally or "on premise", no artifacts remain or leave the system.
Goals
- The user can run a command from the console, to check on a file or directory
- The filemanager contains the "analyze" feature within the context menu
- The local LLM could serve for other use cases where privacy matters
TBD
- Find or write capable one-shot and interactive MCP client
- Find or write simple+secure file access MCP server
- Create local LLM service with appropriate footprint, containerized
- Shell command with options
- KDE integration (Dolphin)
- Package
- Document
Resources
Set Up an Ephemeral Uyuni Instance by mbussolotto
Description
To test, check, and verify the latest changes in the master branch, we want to easily set up an ephemeral environment.
Goals
- Create an ephemeral environment manually
Create an ephemeral environment automatically
Resources
https://github.com/uyuni-project/uyuni
https://www.uyuni-project.org/uyuni-docs/en/uyuni/index.html
Ansible to Salt integration by vizhestkov
Description
We already have initial integration of Ansible in Salt with the possibility to run playbooks from the salt-master on the salt-minion used as an Ansible Control node.
In this project I want to check if it possible to make Ansible working on the transport of Salt. Basically run playbooks with Ansible through existing established Salt (ZeroMQ) transport and not using ssh at all.
It could be a good solution for the end users to reuse Ansible playbooks or run Ansible modules they got used to with no effort of complex configuration with existing Salt (or Uyuni/SUSE Multi Linux Manager) infrastructure.
Goals
- [v] Prepare the testing environment with Salt and Ansible installed
- [v] Discover Ansible codebase to figure out possible ways of integration
- [v] Create Salt/Uyuni inventory module
- [v] Make basic modules to work with no using separate ssh connection, but reusing existing Salt connection
- [v] Test some most basic playbooks
Resources
Move Uyuni Test Framework from Selenium to Playwright + AI by oscar-barrios
Description
This project aims to migrate the existing Uyuni Test Framework from Selenium to Playwright. The move will improve the stability, speed, and maintainability of our end-to-end tests by leveraging Playwright's modern features. We'll be rewriting the current Selenium code in Ruby to Playwright code in TypeScript, which includes updating the test framework runner, step definitions, and configurations. This is also necessary because we're moving from Cucumber Ruby to CucumberJS.
If you're still curious about the AI in the title, it was just a way to grab your attention. Thanks for your understanding.
Nah, let's be honest ![]() AI helped a lot to vibe code a good part of the Ruby methods of the Test framework, moving them to Typescript, along with the migration from Capybara to Playwright. I've been using "Cline" as plugin for WebStorm IDE, using Gemini API behind it.
AI helped a lot to vibe code a good part of the Ruby methods of the Test framework, moving them to Typescript, along with the migration from Capybara to Playwright. I've been using "Cline" as plugin for WebStorm IDE, using Gemini API behind it.
Goals
- Migrate Core tests including Onboarding of clients
- Improve test reliabillity: Measure and confirm a significant reduction of flakiness.
- Implement a robust framework: Establish a well-structured and reusable Playwright test framework using the CucumberJS
Resources
- Existing Uyuni Test Framework (Cucumber Ruby + Capybara + Selenium)
- My Template for CucumberJS + Playwright in TypeScript
- Started Hackweek Project
Enhance setup wizard for Uyuni by PSuarezHernandez
Description
This project wants to enhance the intial setup on Uyuni after its installation, so it's easier for a user to start using with it.
Uyuni currently uses "uyuni-tools" (mgradm) as the installation entrypoint, to trigger the installation of Uyuni in the given host, but does not really perform an initial setup, for instance:
- user creation
- adding products / channels
- generating bootstrap repos
- create activation keys
- ...
Goals
- Provide initial setup wizard as part of mgradm uyuni installation
Resources
Uyuni read-only replica by cbosdonnat
Description
For now, there is no possible HA setup for Uyuni. The idea is to explore setting up a read-only shadow instance of an Uyuni and make it as useful as possible.
Possible things to look at:
- live sync of the database, probably using the WAL. Some of the tables may have to be skipped or some features disabled on the RO instance (taskomatic, PXT sessions…)
- Can we use a load balancer that routes read-only queries to either instance and the other to the RW one? For example, packages or PXE data can be served by both, the API GET requests too. The rest would be RW.
Goals
- Prepare a document explaining how to do it.
- PR with the needed code changes to support it