Project Description
Measure metrics for the QE Yam Squad that are useful and display them on a Grafana dashboard.
Goal for this Hackweek
- Some useful metrics are defined
- Fully understand the code in Project Management Statistics and make use of it.
- Server setup that runs all necessary scripts to fill the databases in the background
- Grafana visualization of the results
Resources
Project Management Statistics on GitHub
Open questions:
Container fails on run with exit code 127 in common
Why? What can I do to prevent this?
How do I obtain access to our Grafana instance so that I can define our own dashboards?
Who are the admins for Grafana?
What virtual machine infrastructure can I use to run the data extraction scripts
For the development I'm fine with a VM running tumbleweed on my local workstation. But for productive use we need some machine that is available 24x7 and can run the scripts.
Project Logbook
2023-11-06
- The
dumper.pyscript that fills the SQLite database is coming at a high cost. Dumping data from Redmine will take about 15 Minutes. Subsequent calls to dumper are way faster, the update the differences since the last run of the script. - The documentation for the demo refers to
Telegrafas an frequent updater. for the InfluxDB that will be then graphically visualized with Grafana, but there is no process that frequently updates the intermediate SQLite database. Update: Maybedumper.pyrun by a cron job. - The containers for the scripts do not work as described in the documentation, we only get error code 127 back when we try to run the container.
- At the moment we have two scripts to create metrics, one for snapshots and one for time ranges. Both scripts are almost similar and all what they do is "counting", e.g. count of issues that have State "IN_PROGRESS" on a given point in time. There is no query that e.g. filters out issues that are in progress and where the last update was X days ago.
- Scripts for metrics need some refactoring, because in some cases we fail on comparison of date with datetime. A first bugfix in for the snapshots script broke the metricsbyperiod script.
- Problem is that at the moment we only have a parsedate function in utils. We should also have a parsedatetime function for the snapshot script. This will be a bigger bugfix.
Results on 2023-11-07
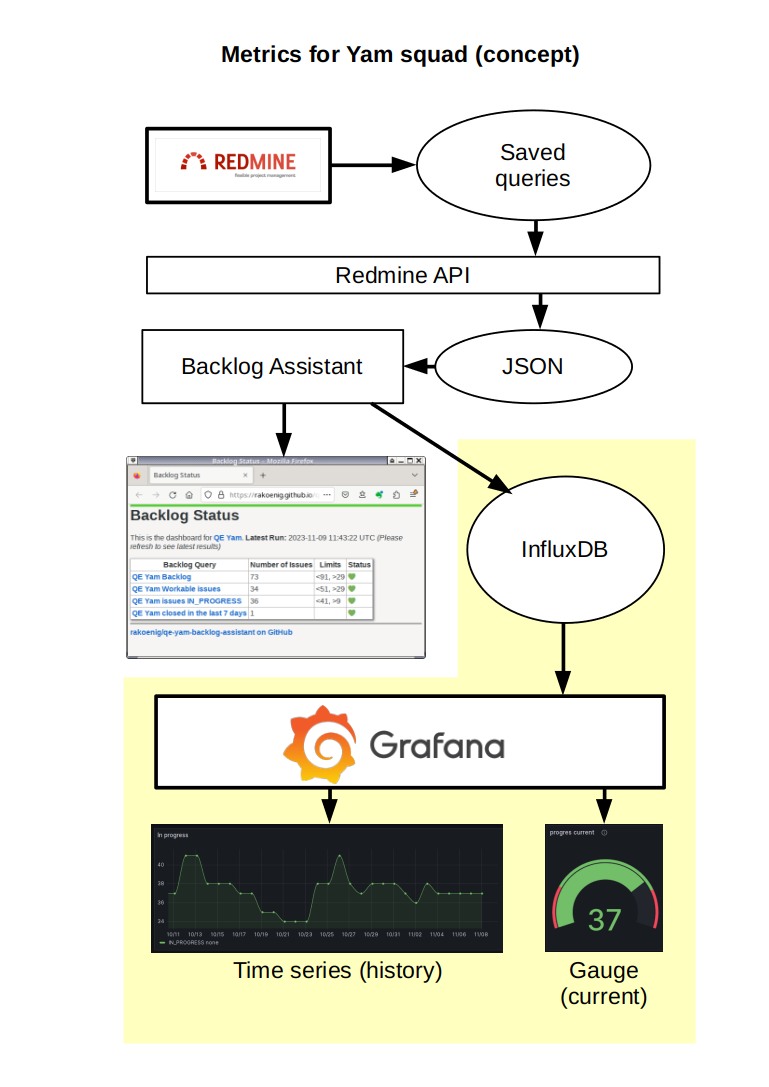
- Created a PoC for the backlog_assistant at https://github.com/rakoenig/qe-yam-backlog-assistant
- Had some troubles with deployment to GitHub pages, but found out how to do this
- Created a page in the progress Wiki with setup and configuration instructions.
Results for 2023-11-08
- Back on Project Managment Statistics running on my Tumbleweed VM:
- Filled the InfluxDB with with current data
- Setup some visualizations in Grafana. Problems:
- PMS just seems to count status issues, so we count 175 issues with status "NEW". Backlog assistant uses stored queries and the query for our backlog is
Status "open" && Target version "none", which gives only 73 issues. Possible solution is to better define what should count as "backlog entrry" and what not. - Fun fact: I was able to emulate a "backlog" query by using
--filter-status "NEW" --filter-target_version "", but the result is still 1 off the result from backlog assistant. The reason seems to be that Redmines query is for Status "open" and "open" means in this context both "New" and "Feedback".
- PMS just seems to count status issues, so we count 175 issues with status "NEW". Backlog assistant uses stored queries and the query for our backlog is
Results for 2023-11-09
- Started to play around with the gauge panel in Grafana. Seems to be easy to use.
- Still wondering how I could get numbers for e.g
priority high && no updates since 7 daysfrom the Project Management Statistics scripts. So far I can don't see a filter for computing date diffs and then filter for that. - On a meta layer we need to define our groups process for handling tickets in Redmine. And then if this process is well defined, we can discuss on useful measurements and how to visualize them.
- It could be also possible to think about a mixture of Project Management Statistics and Backlog Assistant in a way that we use the counting code from Backlog Assistant to obtain the numbers that we're interested in in an easy way and then output the data into a format that can be sent to InfluxDB and then be visualized by Grafana. So we could have gauges for the current situation which are easy to monitor, but also a time series that shows how the numbers looked like in the past weeks.
- Created a what could be.
Results for 2023-11-10
Reflection on what I learned during this HackWeek.
Technical layer
- Learned about the existence of Backlog Assistant
- Learned how to feed data via InfluxDB into Grafana and visualize it
- Learned basics about the Redmine API and how to extract data
- Got a better understanding on the Project Management Statistics tool
Meta layer
- We need to better advertise internal tools like Backlog Assistant. Without his project page I would never heard about this useful tool.
- We urgently need a definition on how our Squad defines things like a backlog in Redmine. The views linked from the slack channel e.g.won't show tickets that have a
target versionset.- Define how a ticket workflow is supposed to work, e.g. like a "state machine". We need to be clear about how we file new tickets (tags, target_versions, status) and what status transistion a ticket than can have.
- Based on this definition we can decide about what we need to measure to make our daily ticket review process easier.

Looking for hackers with the skills:
Nothing? Add some keywords!
This project is part of:
Hack Week 23
Activity
Comments
-

about 2 years ago by okurz | Reply
I recommend you take a look at https://github.com/openSUSE/backlogger, what examples it shows on https://opensuse.github.io/backlogger, how we use it in https://github.com/os-autoinst/qa-tools-backlog-assistant and the results that generates on https://os-autoinst.github.io/qa-tools-backlog-assistant/ . We use that within the SUSE QE Tools team every day
-

about 2 years ago by rainerkoenig | Reply
Thank you Oliver, looks quite interesting. So If I understand it correctly it is based on saved queries in progress.opensuse.org and you refer to them in the queries.yaml file where you also define upper and lower limits for the counted issues. So if I would like to implement something similar, clone the repo, add the API secret, make up my own queries.yaml and remove the line that prevents running on forks?

Reply to rainerkoenig
Thank you Oliver, looks quite interesting. So If I understand it correctly it is based on saved queries in progress.opensuse.org and you refer to them in the queries.yaml file where you also define upper and lower limits for the counted issues. So if I would like to implement something similar, clone the repo, add the API secret, make up my own queries.yaml and remove the line that prevents running on forks?
# A First Level Header ## A Second Level Header Use one asterisk to *emphasize* Use two asterisks for **strong emphasis** - Use hyphens - for unordereed - lists This is an [link to example.com](http://example.com/) This is an image  This is a user link @hans This is a project link hw#some-cool-title
-
-

about 2 years ago by ybonatakis | Reply
@rainerkoenig reach me out tomorrow (Tue) to chat about your findings if you want. Most of them was also my concern of the implementation. I have some ideas but nothing workable or with PoC.
Similar Projects
This project is one of its kind!