Project Description
I have all my photos on a private NAS running nextcloud.
This NAS has an ARM CPU and 1GB of RAM, which means I cannot run the face recognition plugin because it requires a GPU, 2 GB of RAM, and PDLib is not available for this arch (I know I could build it and package it ... but doesn't sound fun ;) )
However, I have a Coral TPU connected to a USB port (Thanks to my super friend Marc!):
https://coral.ai/products/accelerator
Where I could run Tensorflow Lite... you see where this is going, don't you?
Goal for this Hackweek
The goal is to run face recognition on the Coral TPU using tensorflow lite and then using the nextcloud API to tag the images.
Resources

This project is part of:
Hack Week 20
Activity
Comments
Be the first to comment!
Similar Projects
Kubernetes-Based ML Lifecycle Automation by lmiranda
Description
This project aims to build a complete end-to-end Machine Learning pipeline running entirely on Kubernetes, using Go, and containerized ML components.
The pipeline will automate the lifecycle of a machine learning model, including:
- Data ingestion/collection
- Model training as a Kubernetes Job
- Model artifact storage in an S3-compatible registry (e.g. Minio)
- A Go-based deployment controller that automatically deploys new model versions to Kubernetes using Rancher
- A lightweight inference service that loads and serves the latest model
- Monitoring of model performance and service health through Prometheus/Grafana
The outcome is a working prototype of an MLOps workflow that demonstrates how AI workloads can be trained, versioned, deployed, and monitored using the Kubernetes ecosystem.
Goals
By the end of Hack Week, the project should:
Produce a fully functional ML pipeline running on Kubernetes with:
- Data collection job
- Training job container
- Storage and versioning of trained models
- Automated deployment of new model versions
- Model inference API service
- Basic monitoring dashboards
Showcase a Go-based deployment automation component, which scans the model registry and automatically generates & applies Kubernetes manifests for new model versions.
Enable continuous improvement by making the system modular and extensible (e.g., additional models, metrics, autoscaling, or drift detection can be added later).
Prepare a short demo explaining the end-to-end process and how new models flow through the system.
Resources
Updates
- Training pipeline and datasets
- Inference Service py
Extended private brain - RAG my own scripts and data into offline LLM AI by tjyrinki_suse
Description
For purely studying purposes, I'd like to find out if I could teach an LLM some of my own accumulated knowledge, to use it as a sort of extended brain.
I might use qwen3-coder or something similar as a starting point.
Everything would be done 100% offline without network available to the container, since I prefer to see when network is needed, and make it so it's never needed (other than initial downloads).
Goals
- Learn something about RAG, LLM, AI.
- Find out if everything works offline as intended.
- As an end result have a new way to access my own existing know-how, but so that I can query the wisdom in them.
- Be flexible to pivot in any direction, as long as there are new things learned.
Resources
To be found on the fly.
Timeline
Day 1 (of 4)
- Tried out a RAG demo, expanded on feeding it my own data
- Experimented with qwen3-coder to add a persistent chat functionality, and keeping vectors in a pickle file
- Optimizations to keep everything within context window
- Learn and add a bit of PyTest
Day 2
- More experimenting and more data
- Study ChromaDB
- Add a Web UI that works from another computer even though the container sees network is down
Day 3
- The above RAG is working well enough for demonstration purposes.
- Pivot to trying out OpenCode, configuring local Ollama qwen3-coder there, to analyze the RAG demo.
- Figured out how to configure Ollama template to be usable under OpenCode. OpenCode locally is super slow to just running qwen3-coder alone.
Day 4 (final day)
- Battle with OpenCode that was both slow and kept on piling up broken things.
- Call it success as after all the agentic AI was working locally.
- Clean up the mess left behind a bit.
Blog Post
Summarized the findings at blog post.
Local AI assistant with optional integrations and mobile companion by livdywan
Description
Setup a local AI assistant for research, brainstorming and proof reading. Look into SurfSense, Open WebUI and possibly alternatives. Explore integration with services like openQA. There should be no cloud dependencies. Mobile phone support or an additional companion app would be a bonus. The goal is not to develop everything from scratch.
User Story
- Allison Average wants a one-click local AI assistent on their openSUSE laptop.
- Ash Awesome wants AI on their phone without an expensive subscription.
Goals
- Evaluate a local SurfSense setup for day to day productivity
- Test opencode for vibe coding and tool calling
Timeline
Day 1
- Took a look at SurfSense and started setting up a local instance.
- Unfortunately the container setup did not work well. Tho this was a great opportunity to learn some new podman commands and refresh my memory on how to recover a corrupted btrfs filesystem.
Day 2
- Due to its sheer size and complexity SurfSense seems to have triggered btrfs fragmentation. Naturally this was not visible in any podman-related errors or in the journal. So this took up much of my second day.
Day 3
- Trying out opencode with Qwen3-Coder and Qwen2.5-Coder.
Day 4
- Context size is a thing, and models are not equally usable for vibe coding.
- Through arduous browsing for ollama models I did find some like
myaniu/qwen2.5-1m:7bwith 1m but even then it is not obvious if they are meant for tool calls.
Day 5
- Whilst trying to make opencode usable I discovered ramalama which worked instantly and very well.
Outcomes
surfsense
I could not easily set this up completely. Maybe in part due to my filesystem issues. Was expecting this to be less of an effort.
opencode
Installing opencode and ollama in my distrobox container along with the following configs worked for me.
When preparing a new project from scratch it is a good idea to start out with a template.
opencode.json
``` {
Background Coding Agent by mmanno
Description
I had only bad experiences with AI one-shots. However, monitoring agent work closely and interfering often did result in productivity gains.
Now, other companies are using agents in pipelines. That makes sense to me, just like CI, we want to offload work to pipelines: Our engineering teams are consistently slowed down by "toil": low-impact, repetitive maintenance tasks. A simple linter rule change, a dependency bump, rebasing patch-sets on top of newer releases or API deprecation requires dozens of manual PRs, draining time from feature development.
So far we have been writing deterministic, script-based automation for these tasks. And it turns out to be a common trap. These scripts are brittle, complex, and become a massive maintenance burden themselves.
Can we make prompts and workflows smart enough to succeed at background coding?
Goals
We will build a platform that allows engineers to execute complex code transformations using prompts.
By automating this toil, we accelerate large-scale migrations and allow teams to focus on high-value work.
Our platform will consist of three main components:
- "Change" Definition: Engineers will define a transformation as a simple, declarative manifest:
- The target repositories.
- A wrapper to run a "coding agent", e.g., "gemini-cli".
- The task as a natural language prompt.
- The target repositories.
- "Change" Management Service: A central service that orchestrates the jobs. It will receive Change definitions and be responsible for the job lifecycle.
- Execution Runners: We could use existing sandboxed CI runners (like GitHub/GitLab runners) to execute each job or spawn a container.
MVP
- Define the Change manifest format.
- Build the core Management Service that can accept and queue a Change.
- Connect management service and runners, dynamically dispatch jobs to runners.
- Create a basic runner script that can run a hard-coded prompt against a test repo and open a PR.
Stretch Goals:
- Multi-layered approach, Workflow Agents trigger Coding Agents:
- Workflow Agent: Gather information about the task interactively from the user.
- Coding Agent: Once the interactive agent has refined the task into a clear prompt, it hands this prompt off to the "coding agent." This background agent is responsible for executing the task and producing the actual pull request.
- Workflow Agent: Gather information about the task interactively from the user.
- Use MCP:
- Workflow Agent gathers context information from Slack, Github, etc.
- Workflow Agent triggers a Coding Agent.
- Workflow Agent gathers context information from Slack, Github, etc.
- Create a "Standard Task" library with reliable prompts.
- Rebasing rancher-monitoring to a new version of kube-prom-stack
- Update charts to use new images
- Apply changes to comply with a new linter
- Bump complex Go dependencies, like k8s modules
- Backport pull requests to other branches
- Rebasing rancher-monitoring to a new version of kube-prom-stack
- Add “review agents” that review the generated PR.
See also
"what is it" file and directory analysis via MCP and local LLM, for console and KDE by rsimai
Description
Users sometimes wonder what files or directories they find on their local PC are good for. If they can't determine from the filename or metadata, there should an easy way to quickly analyze the content and at least guess the meaning. An LLM could help with that, through the use of a filesystem MCP and to-text-converters for typical file types. Ideally this is integrated into the desktop environment but works as well from a console. All data is processed locally or "on premise", no artifacts remain or leave the system.
Goals
- The user can run a command from the console, to check on a file or directory
- The filemanager contains the "analyze" feature within the context menu
- The local LLM could serve for other use cases where privacy matters
TBD
- Find or write capable one-shot and interactive MCP client
- Find or write simple+secure file access MCP server
- Create local LLM service with appropriate footprint, containerized
- Shell command with options
- KDE integration (Dolphin)
- Package
- Document
Resources
MCP Server for SCC by digitaltomm
Description
Provide an MCP Server implementation for customers to access data on scc.suse.com via MCP protocol. The core benefit of this MCP interface is that it has direct (read) access to customer data in SCC, so the AI agent gets enhanced knowledge about individual customer data, like subscriptions, orders and registered systems.
Architecture
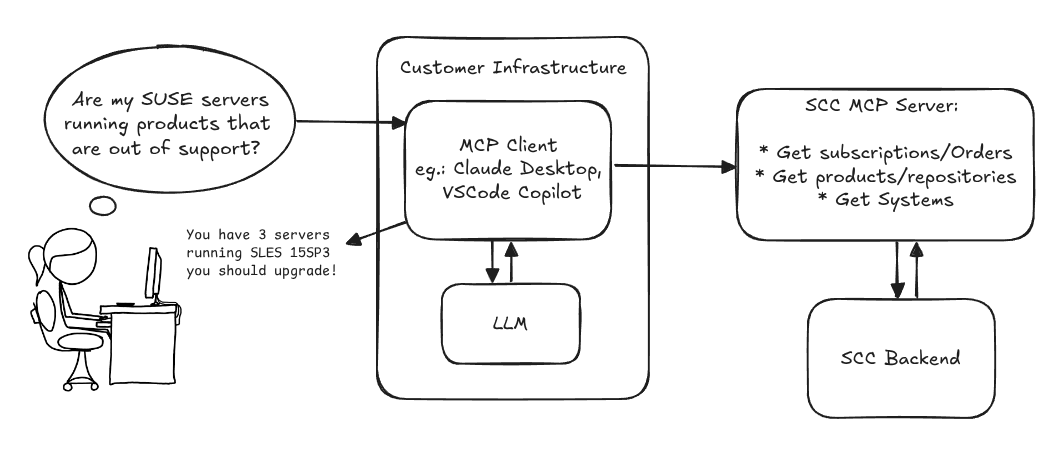
Goals
We want to demonstrate a proof of concept to connect to the SCC MCP server with any AI agent, for example gemini-cli or codex. Enabling the user to ask questions regarding their SCC inventory.
For this Hackweek, we target that users get proper responses to these example questions:
- Which of my currently active systems are running products that are out of support?
- Do I have ready to use registration codes for SLES?
- What are the latest 5 released patches for SLES 15 SP6? Output as a list with release date, patch name, affected package names and fixed CVEs.
- Which versions of kernel-default are available on SLES 15 SP6?
Technical Notes
Similar to the organization APIs, this can expose to customers data about their subscriptions, orders, systems and products. Authentication should be done by organization credentials, similar to what needs to be provided to RMT/MLM. Customers can connect to the SCC MCP server from their own MCP-compatible client and Large Language Model (LLM), so no third party is involved.
Milestones
[x] Basic MCP API setup
  MCP endpoints
  [x] Products / Repositories
  [x] Subscriptions / Orders
  [x] Systems
  [x] Packages
[x] Document usage with Gemini CLI, Codex
Resources
Gemini CLI setup:
~/.gemini/settings.json: