Project Description
The goal is to have a language model, that is able to answer technical questions on Uyuni. Uyuni documentation is too large for in-context processing, so finetuning is the way to go.
Goal for this Hackweek
Finetune a model based on llama-2-7b.
Resources
No Hackers yet
This project is part of:
Hack Week 23
Comments
Be the first to comment!
Similar Projects
Flaky Tests AI Finder for Uyuni and MLM Test Suites by oscar-barrios
Description
Our current Grafana dashboards provide a great overview of test suite health, including a panel for "Top failed tests." However, identifying which of these failures are due to legitimate bugs versus intermittent "flaky tests" is a manual, time-consuming process. These flaky tests erode trust in our test suites and slow down development.
This project aims to build a simple but powerful Python script that automates flaky test detection. The script will directly query our Prometheus instance for the historical data of each failed test, using the jenkins_build_test_case_failure_age metric. It will then format this data and send it to the Gemini API with a carefully crafted prompt, asking it to identify which tests show a flaky pattern.
The final output will be a clean JSON list of the most probable flaky tests, which can then be used to populate a new "Top Flaky Tests" panel in our existing Grafana test suite dashboard.
Goals
By the end of Hack Week, we aim to have a single, working Python script that:
- Connects to Prometheus and executes a query to fetch detailed test failure history.
- Processes the raw data into a format suitable for the Gemini API.
- Successfully calls the Gemini API with the data and a clear prompt.
- Parses the AI's response to extract a simple list of flaky tests.
- Saves the list to a JSON file that can be displayed in Grafana.
- New panel in our Dashboard listing the Flaky tests
Resources
- Jenkins Prometheus Exporter: https://github.com/uyuni-project/jenkins-exporter/
- Data Source: Our internal Prometheus server.
- Key Metric:
jenkins_build_test_case_failure_age{jobname, buildid, suite, case, status, failedsince}. - Existing Query for Reference:
count by (suite) (max_over_time(jenkins_build_test_case_failure_age{status=~"FAILED|REGRESSION", jobname="$jobname"}[$__range])). - AI Model: The Google Gemini API.
- Example about how to interact with Gemini API: https://github.com/srbarrios/FailTale/
- Visualization: Our internal Grafana Dashboard.
- Internal IaC: https://gitlab.suse.de/galaxy/infrastructure/-/tree/master/srv/salt/monitoring
Outcome
- Jenkins Flaky Test Detector: https://github.com/srbarrios/jenkins-flaky-tests-detector and its container
- IaC on MLM Team: https://gitlab.suse.de/galaxy/infrastructure/-/tree/master/srv/salt/monitoring/jenkinsflakytestsdetector?reftype=heads, https://gitlab.suse.de/galaxy/infrastructure/-/blob/master/srv/salt/monitoring/grafana/dashboards/flaky-tests.json?ref_type=heads, and others.
- Grafana Dashboard: https://grafana.mgr.suse.de/d/flaky-tests/flaky-tests-detection @ @ text
Uyuni Health-check Grafana AI Troubleshooter by ygutierrez
Description
This project explores the feasibility of using the open-source Grafana LLM plugin to enhance the Uyuni Health-check tool with LLM capabilities. The idea is to integrate a chat-based "AI Troubleshooter" directly into existing dashboards, allowing users to ask natural-language questions about errors, anomalies, or performance issues.
Goals
- Investigate if and how the
grafana-llm-appplug-in can be used within the Uyuni Health-check tool. - Investigate if this plug-in can be used to query LLMs for troubleshooting scenarios.
- Evaluate support for local LLMs and external APIs through the plugin.
- Evaluate if and how the Uyuni MCP server could be integrated as another source of information.
Resources
Update M2Crypto by mcepl
There are couple of projects I work on, which need my attention and putting them to shape:
Goal for this Hackweek
- Put M2Crypto into better shape (most issues closed, all pull requests processed)
- More fun to learn jujutsu
- Play more with Gemini, how much it help (or not).
- Perhaps, also (just slightly related), help to fix vis to work with LuaJIT, particularly to make vis-lspc working.
Multi-agent AI assistant for Linux troubleshooting by doreilly
Description
Explore multi-agent architecture as a way to avoid MCP context rot.
Having one agent with many tools bloats the context with low-level details about tool descriptions, parameter schemas etc which hurts LLM performance. Instead have many specialised agents, each with just the tools it needs for its role. A top level supervisor agent takes the user prompt and delegates to appropriate sub-agents.
Goals
Create an AI assistant with some sub-agents that are specialists at troubleshooting Linux subsystems, e.g. systemd, selinux, firewalld etc. The agents can get information from the system by implementing their own tools with simple function calls, or use tools from MCP servers, e.g. a systemd-agent can use tools from systemd-mcp.
Example prompts/responses:
user$ the system seems slow
assistant$ process foo with pid 12345 is using 1000% cpu ...

user$ I can't connect to the apache webserver
assistant$ the firewall is blocking http ... you can open the port with firewall-cmd --add-port ...
Resources
Language Python. The Python ADK is more mature than Golang.
https://google.github.io/adk-docs/
https://github.com/djoreilly/linux-helper
Exploring Modern AI Trends and Kubernetes-Based AI Infrastructure by jluo
Description
Build a solid understanding of the current landscape of Artificial Intelligence and how modern cloud-native technologies—especially Kubernetes—support AI workloads.
Goals
Use Gemini Learning Mode to guide the exploration, surface relevant concepts, and structure the learning journey:
- Gain insight into the latest AI trends, tools, and architectural concepts.
- Understand how Kubernetes and related cloud-native technologies are used in the AI ecosystem (model training, deployment, orchestration, MLOps).
Resources
Red Hat AI Topic Articles
- https://www.redhat.com/en/topics/ai
Kubeflow Documentation
- https://www.kubeflow.org/docs/
Q4 2025 CNCF Technology Landscape Radar report:
- https://www.cncf.io/announcements/2025/11/11/cncf-and-slashdata-report-finds-leading-ai-tools-gaining-adoption-in-cloud-native-ecosystems/
- https://www.cncf.io/wp-content/uploads/2025/11/cncfreporttechradar_111025a.pdf
Agent-to-Agent (A2A) Protocol
- https://developers.googleblog.com/en/a2a-a-new-era-of-agent-interoperability/
Enable more features in mcp-server-uyuni by j_renner
Description
I would like to contribute to mcp-server-uyuni, the MCP server for Uyuni / Multi-Linux Manager) exposing additional features as tools. There is lots of relevant features to be found throughout the API, for example:
- System operations and infos
- System groups
- Maintenance windows
- Ansible
- Reporting
- ...
At the end of the week I managed to enable basic system group operations:
- List all system groups visible to the user
- Create new system groups
- List systems assigned to a group
- Add and remove systems from groups
Goals
- Set up test environment locally with the MCP server and client + a recent MLM server [DONE]
- Identify features and use cases offering a benefit with limited effort required for enablement [DONE]
- Create a PR to the repo [DONE]
Resources
Move Uyuni Test Framework from Selenium to Playwright + AI by oscar-barrios
Description
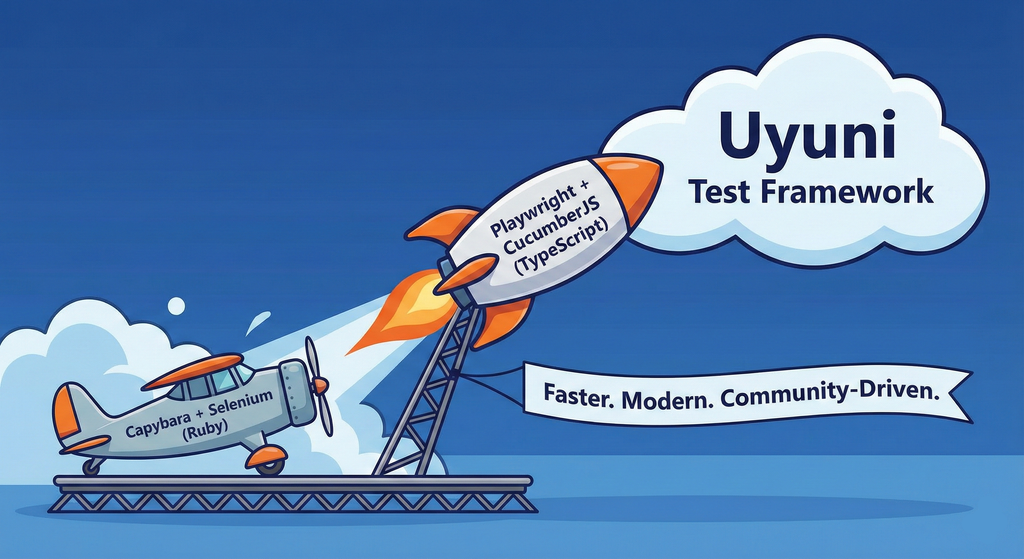
This project aims to migrate the existing Uyuni Test Framework from Selenium to Playwright. The move will improve the stability, speed, and maintainability of our end-to-end tests by leveraging Playwright's modern features. We'll be rewriting the current Selenium code in Ruby to Playwright code in TypeScript, which includes updating the test framework runner, step definitions, and configurations. This is also necessary because we're moving from Cucumber Ruby to CucumberJS.
If you're still curious about the AI in the title, it was just a way to grab your attention. Thanks for your understanding.
Nah, let's be honest ![]() AI helped a lot to vibe code a good part of the Ruby methods of the Test framework, moving them to Typescript, along with the migration from Capybara to Playwright. I've been using "Cline" as plugin for WebStorm IDE, using Gemini API behind it.
AI helped a lot to vibe code a good part of the Ruby methods of the Test framework, moving them to Typescript, along with the migration from Capybara to Playwright. I've been using "Cline" as plugin for WebStorm IDE, using Gemini API behind it.
Goals
- Migrate Core tests including Onboarding of clients
- Improve test reliabillity: Measure and confirm a significant reduction of flakiness.
- Implement a robust framework: Establish a well-structured and reusable Playwright test framework using the CucumberJS
Resources
- Existing Uyuni Test Framework (Cucumber Ruby + Capybara + Selenium)
- My Template for CucumberJS + Playwright in TypeScript
- Started Hackweek Project
Ansible to Salt integration by vizhestkov
Description
We already have initial integration of Ansible in Salt with the possibility to run playbooks from the salt-master on the salt-minion used as an Ansible Control node.
In this project I want to check if it possible to make Ansible working on the transport of Salt. Basically run playbooks with Ansible through existing established Salt (ZeroMQ) transport and not using ssh at all.
It could be a good solution for the end users to reuse Ansible playbooks or run Ansible modules they got used to with no effort of complex configuration with existing Salt (or Uyuni/SUSE Multi Linux Manager) infrastructure.
Goals
- [v] Prepare the testing environment with Salt and Ansible installed
- [v] Discover Ansible codebase to figure out possible ways of integration
- [v] Create Salt/Uyuni inventory module
- [v] Make basic modules to work with no using separate ssh connection, but reusing existing Salt connection
- [v] Test some most basic playbooks
Resources
Set Up an Ephemeral Uyuni Instance by mbussolotto
Description
To test, check, and verify the latest changes in the master branch, we want to easily set up an ephemeral environment.
Goals
- Create an ephemeral environment manually
Create an ephemeral environment automatically
Resources
https://github.com/uyuni-project/uyuni
https://www.uyuni-project.org/uyuni-docs/en/uyuni/index.html
Uyuni Health-check Grafana AI Troubleshooter by ygutierrez
Description
This project explores the feasibility of using the open-source Grafana LLM plugin to enhance the Uyuni Health-check tool with LLM capabilities. The idea is to integrate a chat-based "AI Troubleshooter" directly into existing dashboards, allowing users to ask natural-language questions about errors, anomalies, or performance issues.
Goals
- Investigate if and how the
grafana-llm-appplug-in can be used within the Uyuni Health-check tool. - Investigate if this plug-in can be used to query LLMs for troubleshooting scenarios.
- Evaluate support for local LLMs and external APIs through the plugin.
- Evaluate if and how the Uyuni MCP server could be integrated as another source of information.
Resources